EURAUD Readying to Reverse
Key Points:
-
Long-term bearish bias.
-
Failing to breach a robust resistance level.
-
Parabolic SAR is switching to bearish.
For the exotic traders out there, the EURAUD could be worth keeping an eye on given its potential to tumble in the coming days. The pair has reached a turning point and this could mean a plunge back to the 1.4453 level in the coming weeks. However, EUR fundamentals will likely be in play this week so keep watch for any surprise results which could upset the trend.
Firstly, a quick look a the daily chart shows that the pair has been contending with some rather stiff resistance and looks to have come off second best. This resistance is primarily the result of the downtrend which has been dominating the chart over the past few months. However, the presence of the 38.2% Fibonacci retracement at this point is also lending strength to the zone of resistance. In addition to this, we can also see some dynamic resistance being supplied by the 100 day EMA which should significantly reduce the chances of an upside breakout.
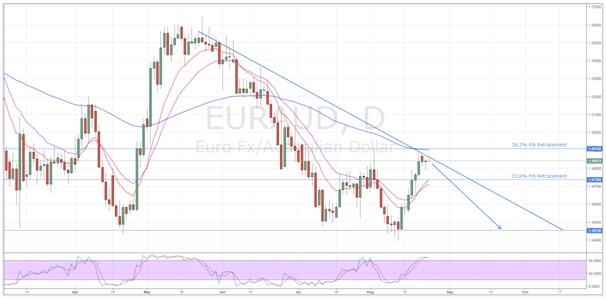
Due to the relatively small chance of a break out, the EURAUD should resume its long-term down trend. In fact, the highly overbought status of the stochastic oscillator should see selling pressure begin to mount and a downtrend take hold. Moreover, the recent switch in the H4 Parabolic SAR from bullish to bearish appears to be suggesting that this has already occurred.
Once the pair begins to decline, it will need to break through the 1.4736 level before the surge lower really takes hold. This level represents the 23.6% Fibonacci level and has proven a difficult support to challenge previously. However, if broken, the EURAUD will be free to descend unhindered to the 1.4453 level before finding another robust support.
On the fundamental front, a number of important EU results are due which could certainly impact the pair and prevent this technical manoeuvre. Namely, both the German Final GDP and IFO Business Climate figures are due shortly and are predicted to show some improvement. Consequently, the EUR might enjoy a swell in sentiment that could push the pair through resistance and prevent the downturn occurring.
Ultimately, this pair has been showing a substantial bearish bias from some time and the recent rally could have finally run out of momentum. As discussed, the current resistance level is highly robust and is likely to hold in the absence of some strong fundamentals. Additionally, there are hints that the pair is already in the process of making a reversal and is about to move back to the long term support. Consequently, keep an eye on the EURAUD as it nears that 23.6% Fibonacci as it is likely to be the only obstacle to a major plunge.
Author

Matthew Ashley
Blackwell Global Investments Limited
Matthew joined Blackwell Global in March 2016; he works as a currency analyst in the research department based in Auckland.


