EUR vs. USD - 61.8% Ratio In EURO/US$ Ends 3rd Wave Impulse

EUR/USD Background
It’s no secret that the Euro/USD has gone from the most shorted currency against the US$ dollar at the beginning of this year when trading began at 1.0341 to the most net long as of last week’s close. Basis IMM data, the net short has swung completely around from minus -$9.0bn to plus +$12.0bn over the course of the last 6 ½ months whilst the Euro/US$ has traded up to 1.1584.
But that’s not the entire story – the Euro/USD has been one of the most shorted currencies over the last few years. Sentiment has remained firmly bearish for the Euro during the Sovereign Debt Crisis of 2008-2012 when Icelandic banks collapsed, then later, focus transferred to illiquidity and funding in the ‘PIGS’, Portugal, Ireland, Greece and Spain. There were also occasions when Italy was thought to be on the brink of sovereign debt default so sentiment was overall low with many pundits, analysts and forecasters suggesting a collapse of the Euro/USD below parity and a break-up of the European Union.
Fast-forward to today and the picture is quite the opposite – where are these doom-and-gloom protagonists now?
EUR/USD from and Elliott Wave Perspective
From an Elliott Wave perspective, the Euro/USD was never in any danger of collapsing into oblivion – why? To answer that, first, you have to take a look at the very long-term pattern development from historical lows of the early 1920’s. This was a time of the Reichsmark, later becoming the Deutsche Mark and from 1999, the Euro as we know it today. But back then, this historical low triggered a centennial triple zig zag pattern that remains in progress to this very day. Over the last 8-years, the Euro/USD has simply undergone a cycle wave B corrective decline within the third zig zag sequence that ended last January at 1.0341 – a new era of advances has since begun cycle wave C.
It’s still early days in cycle wave C’s advance though. With ultimate upside targets far above the 1.6040 levels traded at the previous peak of cycle wave A, this year’s advance is really just the beginning of the 1st wave within cycle wave C. And within this 1st wave, a self-similar five wave pattern is unfolding higher from 1.0341 revealing the markets fractal qualities. We’ve assigned this advance in intermediate degree, (1)-(2)-(3)-(4)-(5).
EUR/USD and Fibonacci-Price-Ratios
It just so happens that intermediate wave (3) is approaching a near-term top – see fig #1.
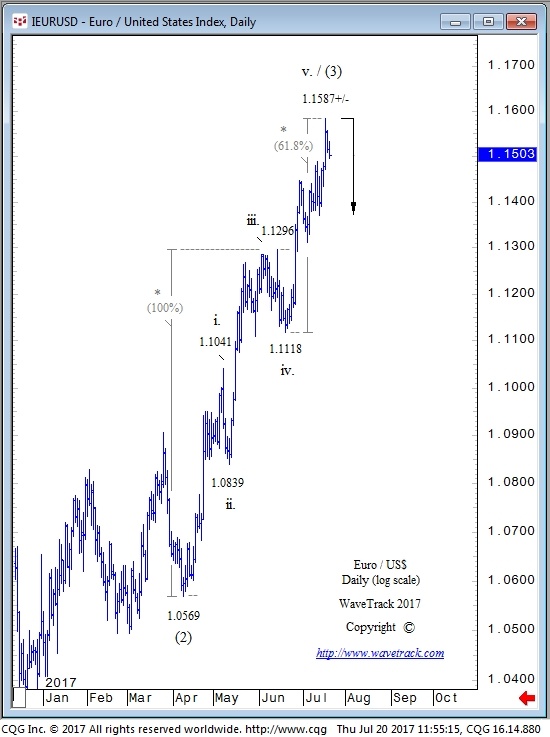
Fig #1 - EUR vs. USD - Daily by WaveTrack International
This is not just a guess – we can ‘proof’ this impulse advance is at a terminal phase using fib-price-ratios. Wave (3) subdivides into a five wave expanding-impulse pattern labelled in minor degree, i-ii-iii-iv-v –
-
The net advance between minor waves i-iii x 61.8% = wave v. @ 1.1585 (log scale)
-
Minor waves iii and v = 100% equality ratio @ 1.1587 (log scale)
So far, the high traded to 1.1584.
It also interesting that sentiment is very high right now, at a time when the IMM data is hitting a new multi-month high. This indicates the Euro/US$ is about to trade lower in its first meaningful correction since last February, as intermediate wave (4) – watch this space!
Subscribe and get the latest forecasts on Stocks, FX & Commodities – NOW!
Author

Peter Goodburn
WaveTrack International GmbH
WTI HISTORY


