EUR/USD: will the bearish momentum continue today?

EUR/USD continues its bearish journey on the daily chart. The pair produced a strong bearish candle yesterday as well followed by an inside bar. The candle closed within a level of daily support, where the price had a bounce last month. If the level gets breached, the price may head towards the South with stronger bearish momentum since the price may support its next support at the last swing low, which offers a handful of pips. Major intraday charts are on consolidation. A lot depends on them. Let us have a look at those three charts.
Chart 1 EUR/USD Daily Chart
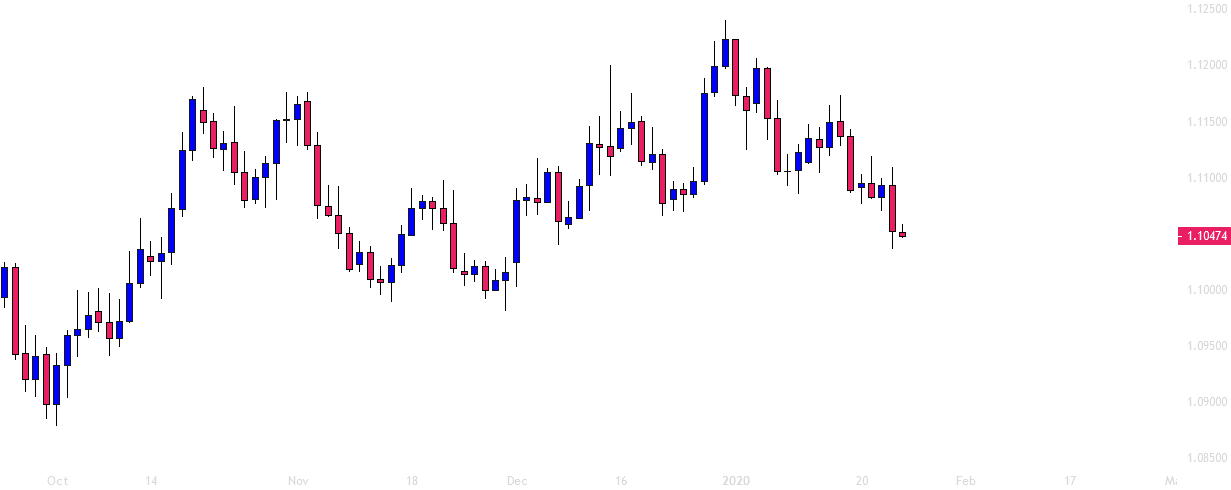
The chart shows that the price found its resistance at the level of 1.12245. Upon producing a bearish engulfing candle, the price has been heading towards the South. The pair is trading around the level of 1.10475, where the price had made a bullish breakout and made a strong bullish move after a pullback. The buyers would love to get a bullish reversal candle here again. However, the momentum is with the bear, thus, the pair may make a bearish breakout at the level and head towards the level of 1.10000.
Chart 2 EUR/USD H4 Chart
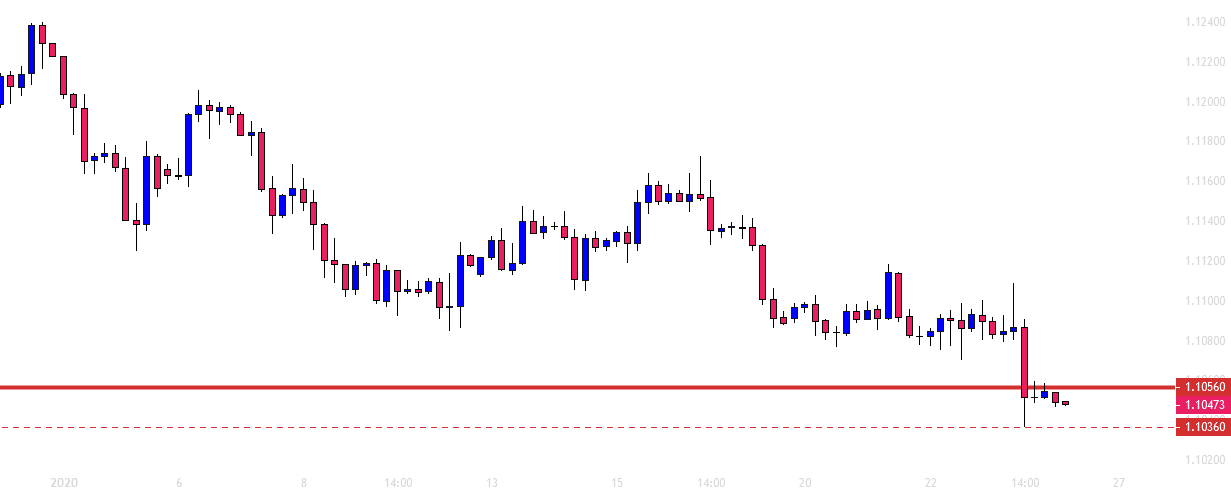
The H4 chart shows that the price has kept making lower lows. It had its last bounce at the level of 1.10360. The level of 1.10560 has been working as a level of resistance. The level has already produced a bearish engulfing candle. If the price keeps going towards the downside and makes a breakout at the level of 1.10360, the sellers may go short on the pair and drive the price towards the South further. The price may find its next support at the level of 1.10000 on the H4 chart as well.
Chart 3 EUR/USD H1 Chart
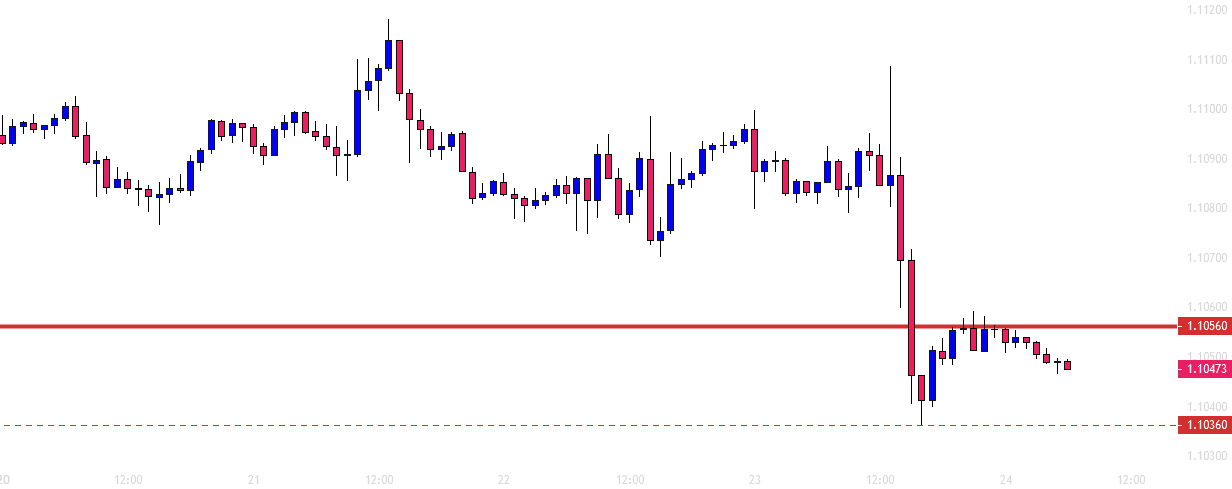
The price after being bearish made an upward correction. It found its resistance at the same level as the H4 chart. The way the price has been heading towards the South, it does not seem it would make a bearish breakout. If it does, the sellers may go short on the pair. On the other hand, if it bounces at the level of support again, the buyers may look for long opportunities on the minor charts. This may make the pair produce a corrective bullish candle on the daily chart in the end.
The daily and the H4 chart look bearish. The H1 chart looks a bit neutral. Considering these three charts, the pair has more chances to get bearish. A lot depends on the H1 chart’s price action though. If it gets bearish, the pair may continue its bearish momentum today as well.
Author

EagleFX Team
EagleFX
EagleFX Team is an international group of market analysts with skills in fundamental and technical analysis, applying several methods to assess the state and likelihood of price movements on Forex, Commodities, Indices, Metals and


