EUR/USD Weekly Forecast: US GDP and PCE data can shake investors’ beliefs
- The European Central Bank failed to motivate investors with an uneventful monetary policy announcement.
- The United States will release updates on the Gross Domestic Product and inflation next week.
- EUR/USD in a corrective slide, 1.0800 must hold for bulls to retain control.

The EUR/USD pair halted its latest run and is closing the week unchanged, just below the 1.0900 mark. However, it reached a fresh multi-month high of 1.0947 mid-week, only turning south after the European Central Bank (ECB) uneventful monetary policy announcement.
Central banks still in the eye of the storm
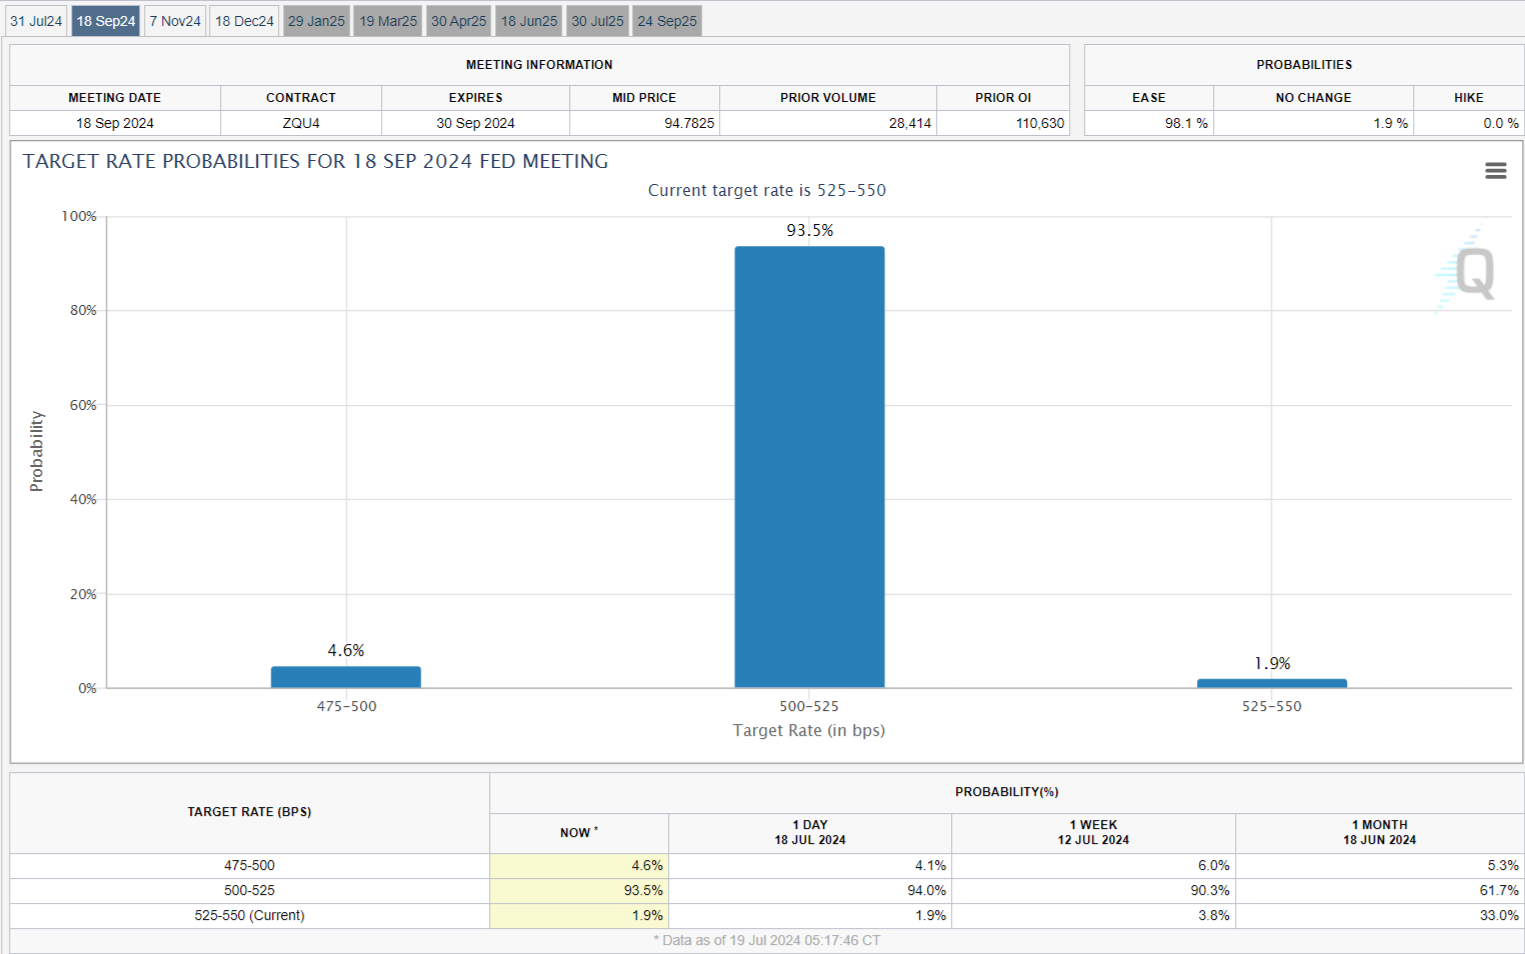
Optimism about an upcoming interest rate cut in the United States (US) put the US Dollar under strong selling pressure at the beginning of the week. Market participants priced in 100% odds the Federal Reserve (Fed) will trim rates in the September meeting, according to the CME FedWatch Tool, with a small percentage even betting for a 50 basis points (bps) cut. By the end of the week, the odds for an on-hold decision stand at 1.9%.
Risk sentiment, however, helped the USD alongside the ECB. On the one hand, the European Central Bank left rates unchanged as widely anticipated and refused to commit to any particular monetary path. Policymakers repeated that rate decisions will be data-dependant and made meeting by meeting. As a result, the Euro held static after the announcement.
On the other hand, the tech sector tumbled after the US Joe Biden administration threatened severe restrictions on exports by foreign chipmakers to China. The stock decline resumed on Friday, further fueling the Greenback, as a global internet outage affected multiple and diverse sectors and companies, including the London Stock Exchange.
Data-wise, the US reported that Retail Sales remained pretty much unchanged in June, as expected, although the core reading, Retail Sales ex Autos, rose 0.4%, better than the previous 0.1%. Across the pond, the Eurozone confirmed that the Harmonized Index of Consumer Prices (HICP) was up by 2.5% YoY in June.
United States first-tier events to deter USD tone
The US data will take centre stage next week, as the country will release the first estimate of the Q2 Gross Domestic Product (GDP) and the June Personal Consumption Expenditures (PCE) Price Index, the Fed's favorite inflation gauge. The PCE index stood at 2.5% YoY in May, and any reading below such a level should fuel hopes for a September cut.
However, growth data could also affect the Fed’s decision. If the economy progresses at a faster-than-anticipated rate, it would suggest the current interest rate can persist for longer. Consider a scenario in which upbeat GDP and PCE figures could make speculative interest change its mind regarding September. The US Dollar can run on the news, turning the current corrective advance into a bullish rally.
Other than that, S&P Global alongside regional banks, will publish the preliminary estimates of the Purchasing Managers Indexes (PMIs) for most major economies. Finally, it is worth remembering US central bank officials will be in the blackout period ahead of the July 30-31 policy meeting.

EUR/USD technical outlook
From a technical point of view, the EUR/USD pair stands at the upper end of its latest range, and the risk remains skewed to the upside. In the weekly chart, the pair develops above its 20 and 100 Simple Moving Averages (SMAs), which lack directional strength. At the same time, a mildly bearish 200 SMA provides dynamic resistance at around 1.1080. The Momentum indicator aims north above its 100 line, while the Relative Strength Index (RSI) indicator turned flat at around 55, suggesting that, while buyers retain control, interest has decreased. Still, there are no technical signs that suggest the pair could abandon its current trend.
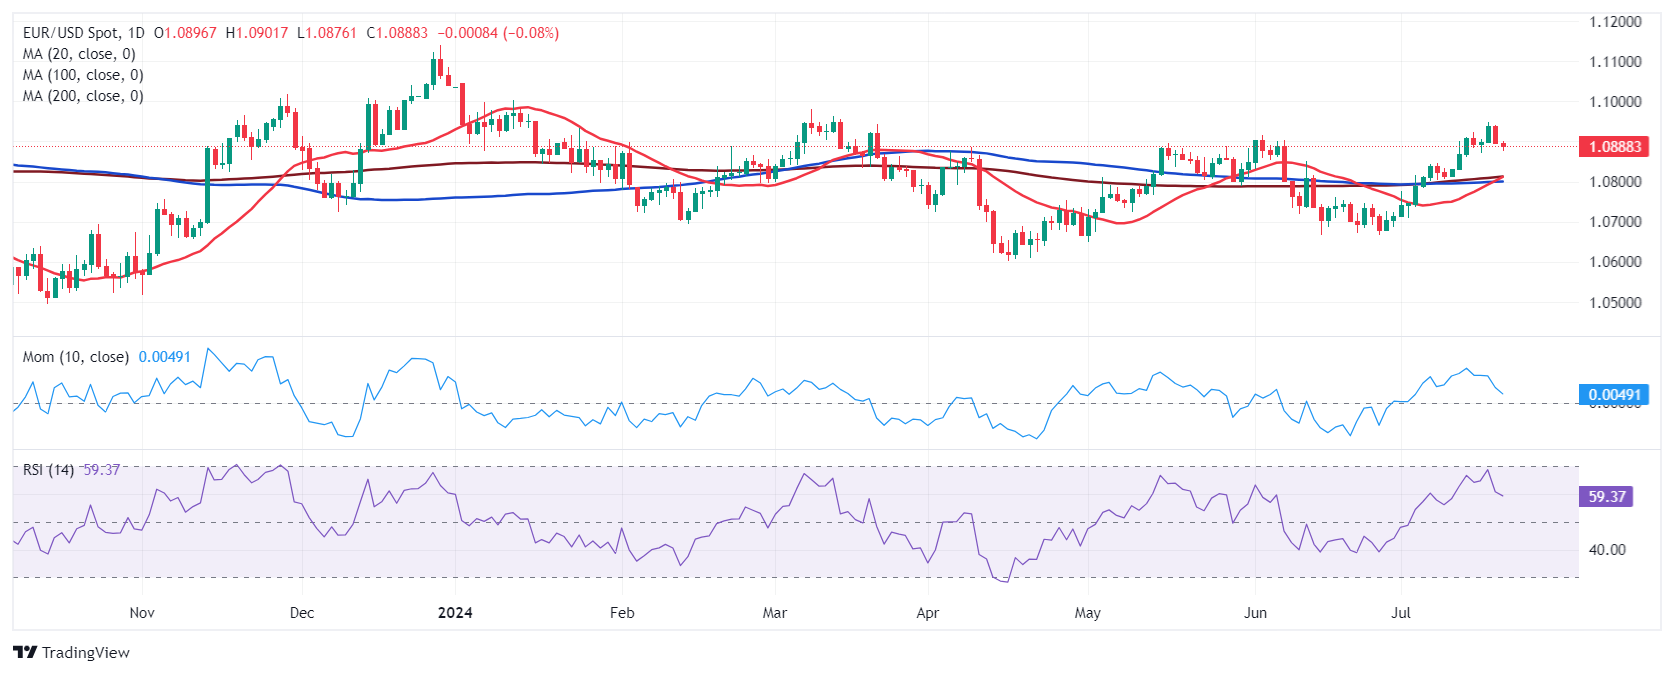
In the daily chart, technical readings are aligned with the ongoing downward correction, yet far from suggesting the slide may extend in time. Technical indicators have retreated from overbought readings, offering downward slopes but still within positive levels. Moving averages, on the other hand, remain well below the current level, in line with the dominant bullish trend. Furthermore, a firmly bullish 20 SMA is crossing above converging and directionless 100 and 200 SMAs, usually a sign of additional gains ahead.
EUR/USD needs to hold above 1.0800 to keep the bullish trend alive, with a break below the level exposing the 1.0740 region, en route to 1.0660. The year low at 1.0600 is the a major bearish target should the US Dollar return to the spotlight. Resistance comes at 1.0950, followed by the 1.1000 psychological threshold. Gains beyond the latter should result in EUR/USD testing 1.1080, followed later by the 1.1140 price zone.
Economic Indicator
Gross Domestic Product Annualized
The real Gross Domestic Product (GDP) Annualized, released quarterly by the US Bureau of Economic Analysis, measures the value of the final goods and services produced in the United States in a given period of time. Changes in GDP are the most popular indicator of the nation’s overall economic health. The data is expressed at an annualized rate, which means that the rate has been adjusted to reflect the amount GDP would have changed over a year’s time, had it continued to grow at that specific rate. Generally speaking, a high reading is seen as bullish for the US Dollar (USD), while a low reading is seen as bearish.
Read more.Next release: Thu Jul 25, 2024 12:30 (Prel)
Frequency: Quarterly
Consensus: 2%
Previous: 1.4%
Source: US Bureau of Economic Analysis
The US Bureau of Economic Analysis (BEA) releases the Gross Domestic Product (GDP) growth on an annualized basis for each quarter. After publishing the first estimate, the BEA revises the data two more times, with the third release representing the final reading. Usually, the first estimate is the main market mover and a positive surprise is seen as a USD-positive development while a disappointing print is likely to weigh on the greenback. Market participants usually dismiss the second and third releases as they are generally not significant enough to meaningfully alter the growth picture.
Inflation FAQs
Inflation measures the rise in the price of a representative basket of goods and services. Headline inflation is usually expressed as a percentage change on a month-on-month (MoM) and year-on-year (YoY) basis. Core inflation excludes more volatile elements such as food and fuel which can fluctuate because of geopolitical and seasonal factors. Core inflation is the figure economists focus on and is the level targeted by central banks, which are mandated to keep inflation at a manageable level, usually around 2%.
The Consumer Price Index (CPI) measures the change in prices of a basket of goods and services over a period of time. It is usually expressed as a percentage change on a month-on-month (MoM) and year-on-year (YoY) basis. Core CPI is the figure targeted by central banks as it excludes volatile food and fuel inputs. When Core CPI rises above 2% it usually results in higher interest rates and vice versa when it falls below 2%. Since higher interest rates are positive for a currency, higher inflation usually results in a stronger currency. The opposite is true when inflation falls.
Although it may seem counter-intuitive, high inflation in a country pushes up the value of its currency and vice versa for lower inflation. This is because the central bank will normally raise interest rates to combat the higher inflation, which attract more global capital inflows from investors looking for a lucrative place to park their money.
Formerly, Gold was the asset investors turned to in times of high inflation because it preserved its value, and whilst investors will often still buy Gold for its safe-haven properties in times of extreme market turmoil, this is not the case most of the time. This is because when inflation is high, central banks will put up interest rates to combat it. Higher interest rates are negative for Gold because they increase the opportunity-cost of holding Gold vis-a-vis an interest-bearing asset or placing the money in a cash deposit account. On the flipside, lower inflation tends to be positive for Gold as it brings interest rates down, making the bright metal a more viable investment alternative.
Author

Valeria Bednarik
FXStreet
Valeria Bednarik was born and lives in Buenos Aires, Argentina. Her passion for math and numbers pushed her into studying economics in her younger years.