EUR/USD weakens as USD stabilizes – Can 1.1550 hold?
- EUR/USD loses upside traction, sliding back toward the 1.1550 demand zone as bullish momentum weakens on both the Daily and H4 charts.
- Main driver: Euro remains pressured by weak Eurozone fundamentals while USD stabilizes as the U.S. government reopens and political uncertainty fades.
- Technical forecast: Bias leans mildly bearish unless EUR/USD reclaims 1.1610; a break below 1.1550 exposes 1.1500 next.

EUR/USD sustains pressure as buyers lose momentum
EUR/USD continues to drift lower after failing to extend last week’s recovery. The pair attempted to retest 1.1650 but quickly lost steam, with selling pressure resurfacing across both the H4 and Daily timeframes. The candles have progressively shown weaker upward drives, heavier wicks, and more decisive bearish follow-through — clear signs that the short-term bullish structure is breaking down.
With the U.S. government reopening, uncertainty has cooled, allowing the U.S. Dollar to regain footing after weeks of volatility caused by delayed economic data. As markets shift ahead of upcoming CPI, PCE, and labor market releases, EUR/USD remains capped on rallies.
Price is now hovering just above 1.1570–1.1550, a critical short-term support zone.
Main driver behind the EUR/USD move
Eurozone macro weakness
The Eurozone continues to underperform relative to the U.S. in GDP momentum, consumption, and business confidence. Softer inflation reduces ECB pressure, prompting expectations of earlier rate cuts compared to the Federal Reserve.
USD stabilization as US Government reopens
The reopening has:
- Reduced domestic uncertainty.
- Restored the timeline for major data releases.
- Supported Treasury market normalization.
This has stabilized USD demand, weighing on EUR/USD.
Fragile global risk sentiment
Ahead of key U.S. data, risk appetite remains mixed. During such periods, USD tends to attract safer flows — particularly when Eurozone fundamentals are soft.
Technical outlook
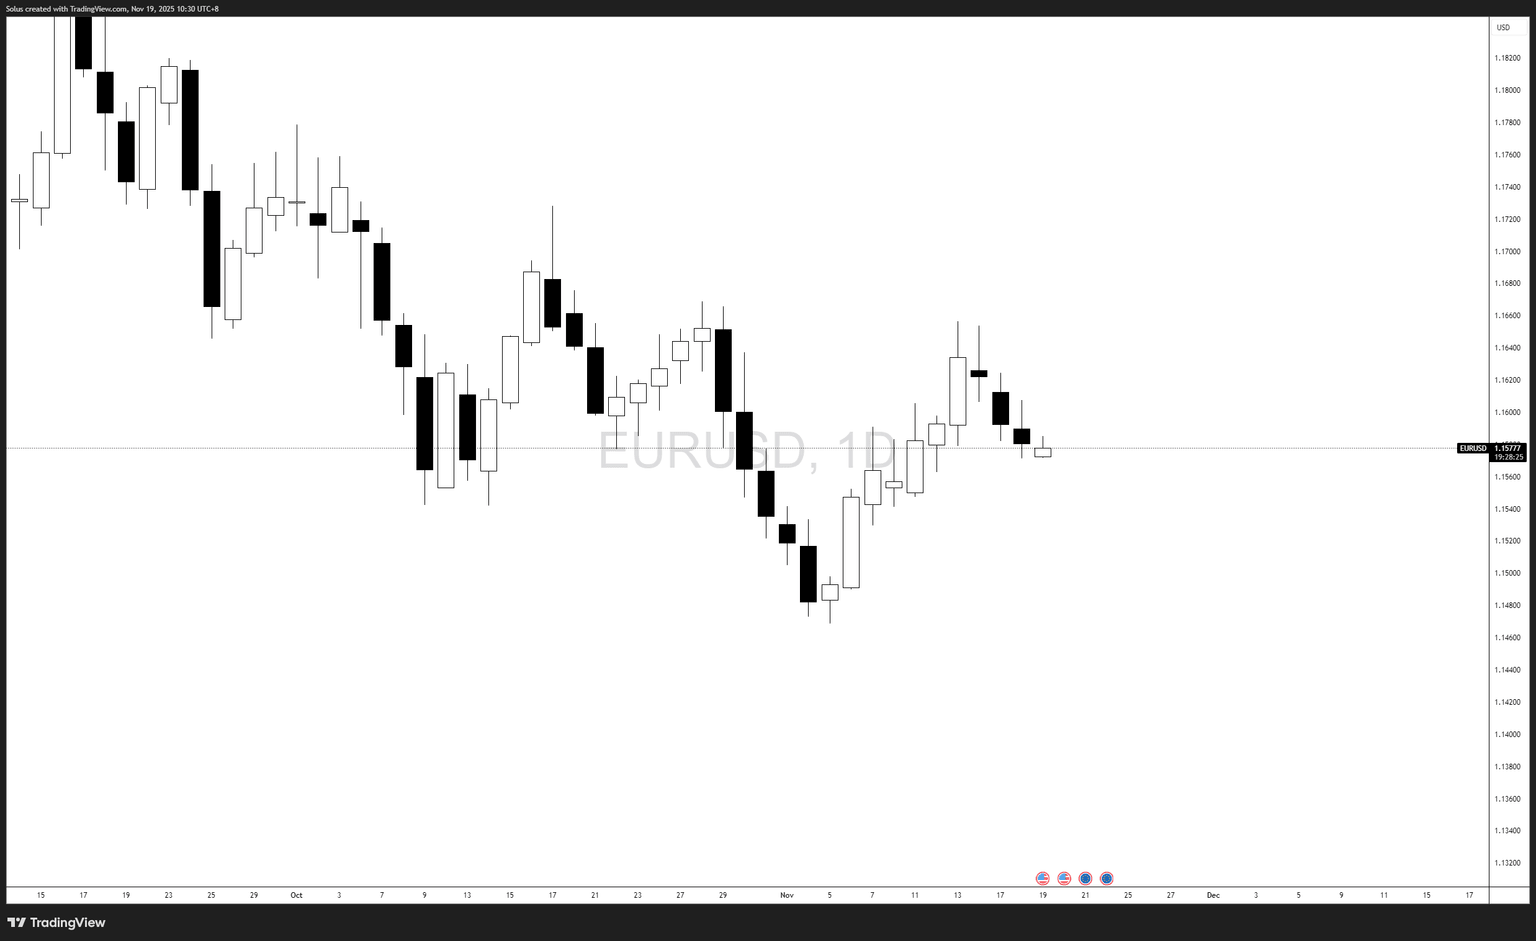
Daily chart
- Failure at 1.1650 created a lower-high rejection.
- Recent candles reflect shrinking bullish strength and heavier downward pressure.
- Price is compressing toward 1.1550.
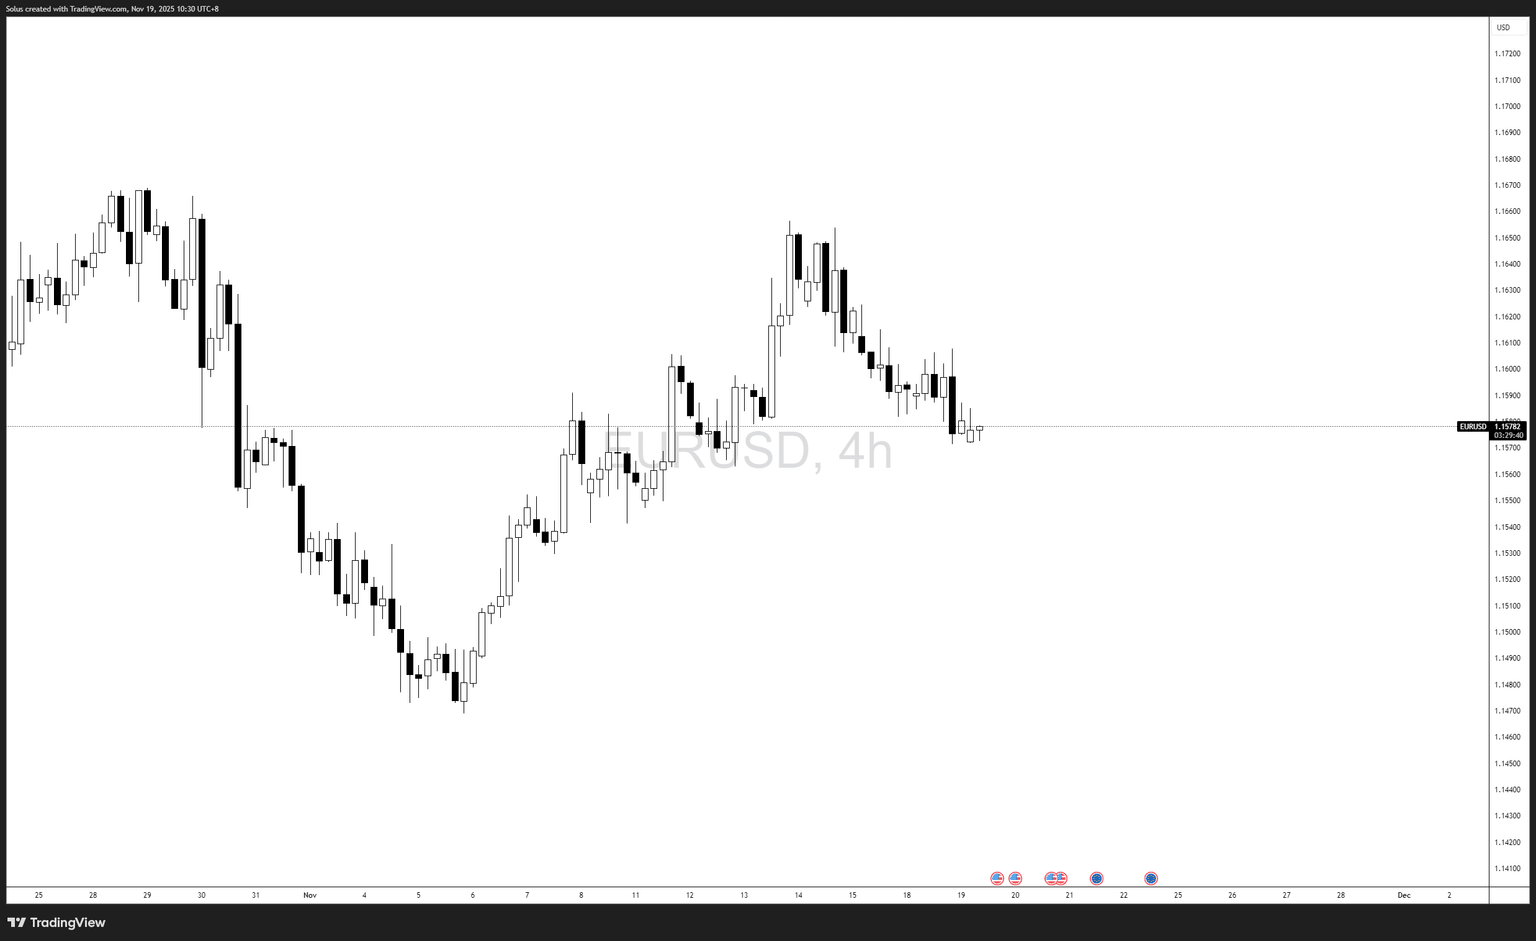
Four-hour chart
- Clear lower-high sequence since November 14 indicates sellers dominating the structure.
- Break of short-term bullish structure confirms downward momentum.
- Buyers show no meaningful defense so far.
Bullish scenario
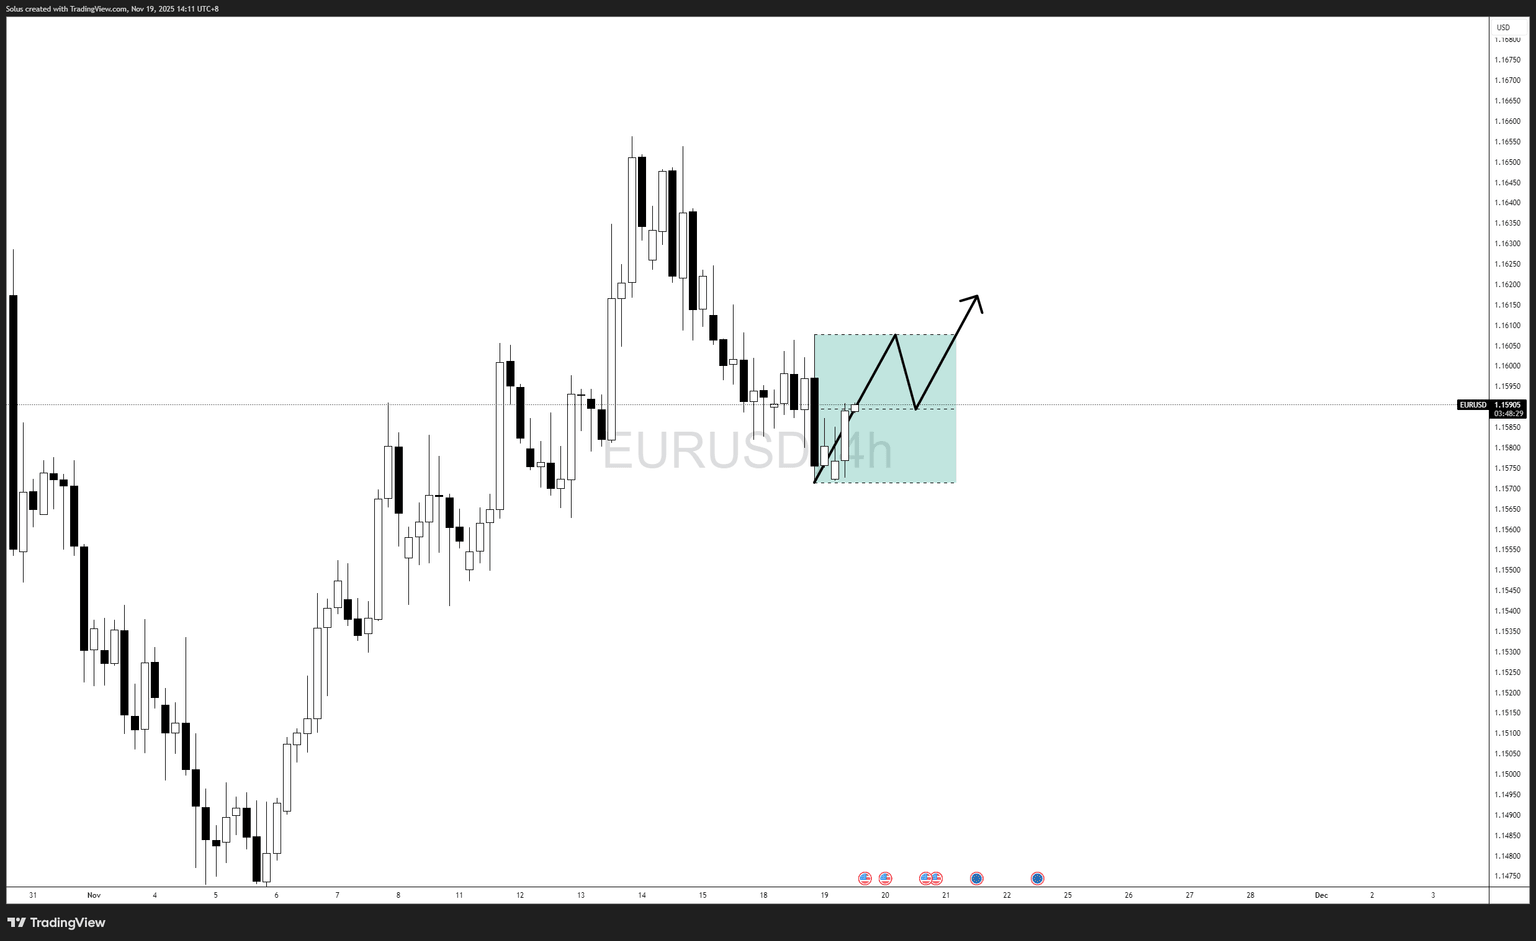
EUR/USD turns bullish only if price uses the 1.1550–1.1570 region as a springboard, as shown in your first diagram.
What the bullish sequence looks like (exact chart behavior shown):
- Price dips slightly into the shaded demand region.
- Buyers step in and create an initial bounce.
- A small intraday pullback forms (internal retracement), holding above the low.
- Price then pushes upward to break short-term structure.
- Continuation into 1.1610, with potential extension toward 1.1650.
Bullish confirmation
- Higher-low inside the demand zone
- Break above the short-term swing at 1.1605–1.1610
- Market structure shift to the upside on H4
Bullish targets
- Target 1: 1.1610
- Target 2: 1.1650
Bearish scenario
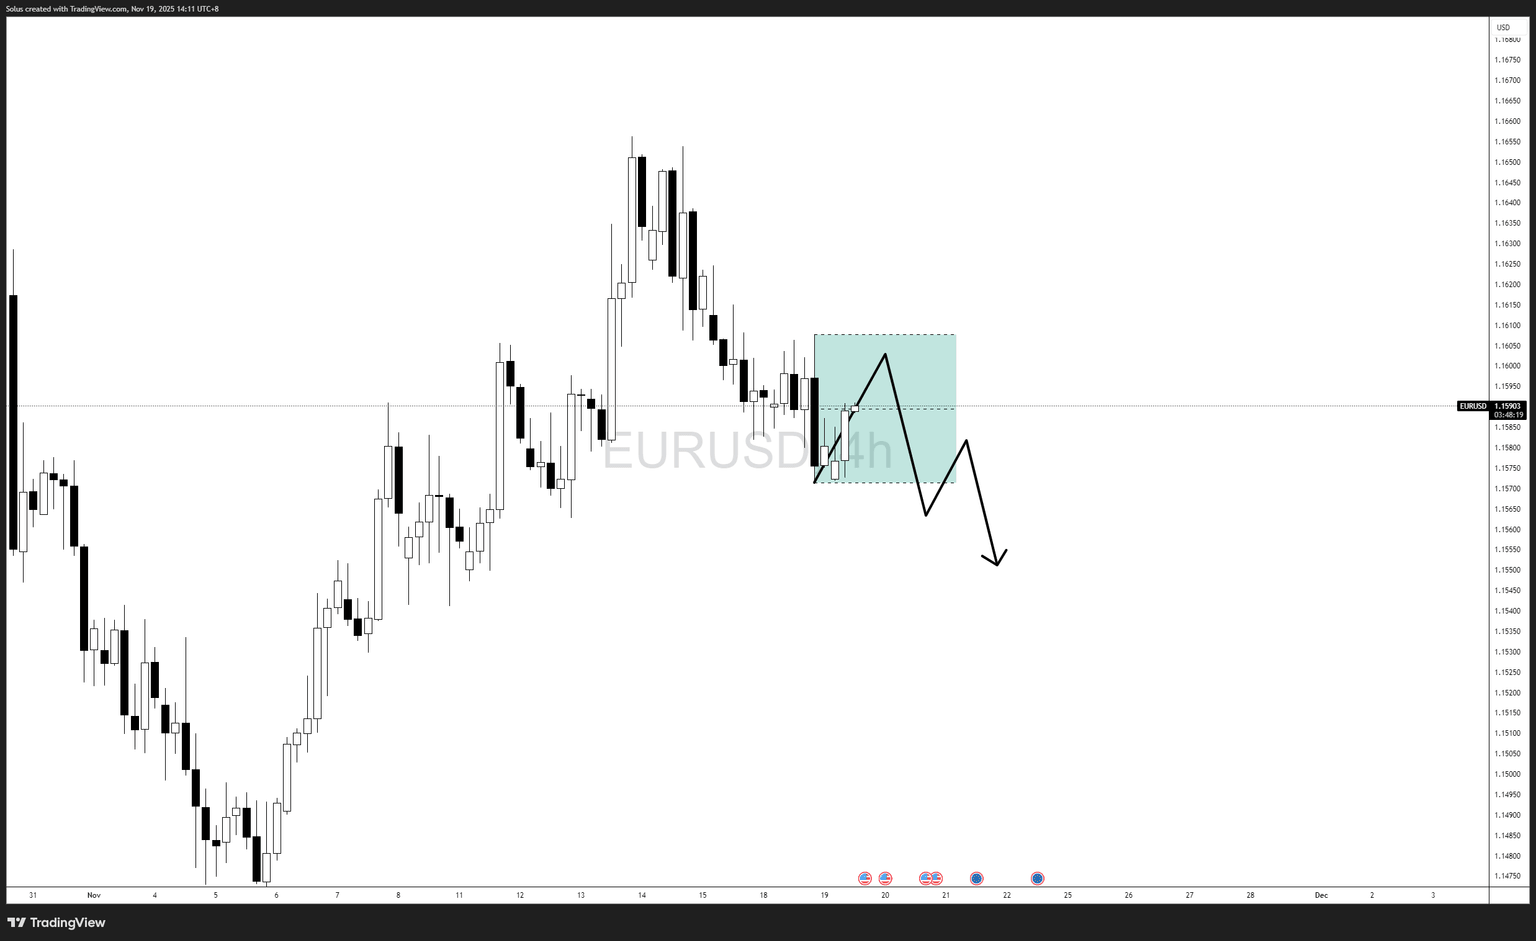
The bearish scenario follows the exact displacement and pullback behavior shown in your second diagram.
What the bearish sequence looks like (price-flow from your chart):
- Price bounces slightly inside the shaded box
- Fails to break above 1.1610
- Rejects from the upper boundary of the box
- Forms a lower high
- Bearish continuation breaks below the internal low
- Sell-side extension into 1.1550, then 1.1500
Bearish confirmation
- Rejection from 1.1605–1.1610
- Lower high formation inside the shaded zone
- Clean break below the short-term low around 1.1570
Bearish targets
- Target 1: 1.1550
- Target 2: 1.1500
Final thoughts
EUR/USD sits at a major inflection point. With momentum favoring sellers and fundamentals supporting USD stabilization, the pair risks deeper downside unless bulls defend 1.1550 and reclaim 1.1610. Losing this zone exposes 1.1500 next.
Author

Jasper Osita
Independent Analyst
Jasper has been in the markets since 2019 trading currencies, indices and commodities like Gold. His approach in the market is heavily accompanied by technical analysis, trading Smart Money Concepts (SMC) with fundamentals in mind.


