EUR/USD: US data disappoints, now it´s on Trump

EUR/USD Current price: 1.0595
View Live Chart for the EUR/USD
The dollar eased ahead of the US opening, and ahead of the highly anticipated speech of US President Trump before the Congress, following the release of softer-than-expected US data. Fourth quarter GDP second revision came in at 1.9%, matching the first estimate, but below market's expectations of 2.1%. Also, personal consumption expenditures during the quarter rose by less than expected, up by 1.9% against previous and expected 2.2%, while on a modestly positive tone, January wholesales inventories fell by 0.1% from a previous advance of 1.0%.
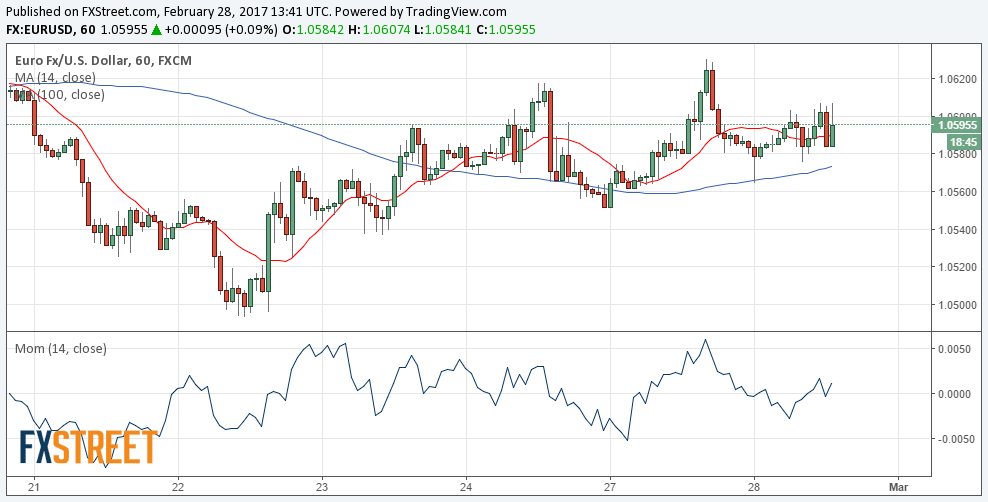
The EUR/USD pair recovered some ground with the news but remains below the 1.0600 region ahead of Trump, short term in consolidative mode. The 1 hour chart shows that the price is above the daily trend line coming from 1.0828, but below past week high of 1.0635, while the price struggles around the 20 and 200 SMAs, and indicators aim higher after bouncing from their mid-lines, but below previous daily highs, indicating limited buying interest at this point. In the 4 hours chart, the price holds above a bullish 20 SMA, but technical indicators turned lower within neutral territory, whilst the 100 SMA maintains a sharp bearish slope above the current level, in line with the shorter term perspective.
Support levels: 1.0565 1.0520 1.0470
Resistance levels: 1.0635 1.0660 1.0705
GBP/USD Current price: 1.2420
View Live Chart for the GBP/USD
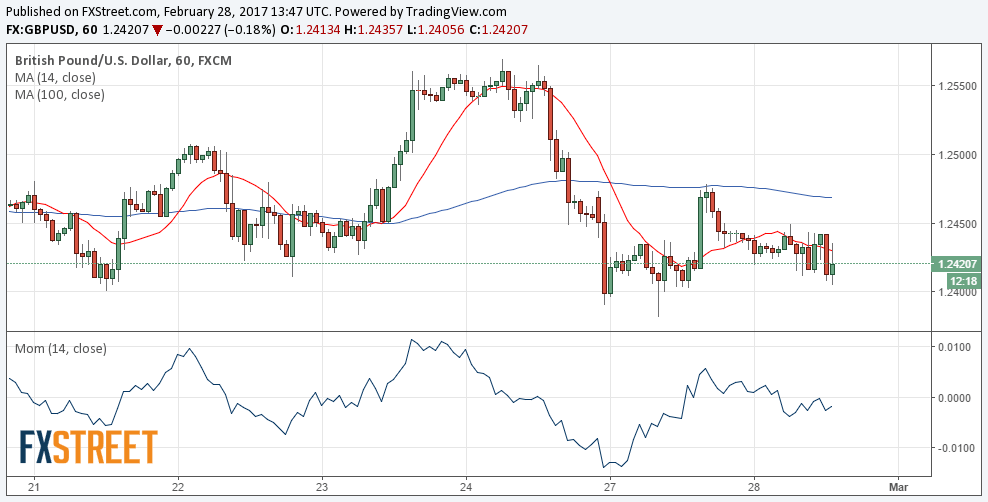
The GBP/USD pair bounced from a daily low of 1.2405 following disappointing US data, but was unable to sustain gains and retreats from the 1.2440 region, where it spend most of the day. The Pound weakened at the beginning of the week on speculation Scotland will have an independence referendum shortly, and maintains the soft tone against most of its major rivals, waiting for some clarity on the matter. Technically, the risk is towards the downside, as in the 1 hour chart, the price develops below a bearish 20 SMA, that converges with a Fibonacci resistance around the mentioned 1.2440 level, whilst technical indicators hover within bearish territory, with no certain directional strength. In the 4 hours chart, technical readings favor the downside, as the price is developing below a modestly bearish 20 SMA, whilst technical indicators maintain their bearish slopes within negative territory. Still, the pair needs to break below 1.2345, February low, to confirm additional slides ahead.
Support levels: 1.2380 1.2345 1.2300
Resistance levels: 1.2440 1.2490 1.2535
USD/JPY Current price: 112.14
View Live Chart for the USD/JPY
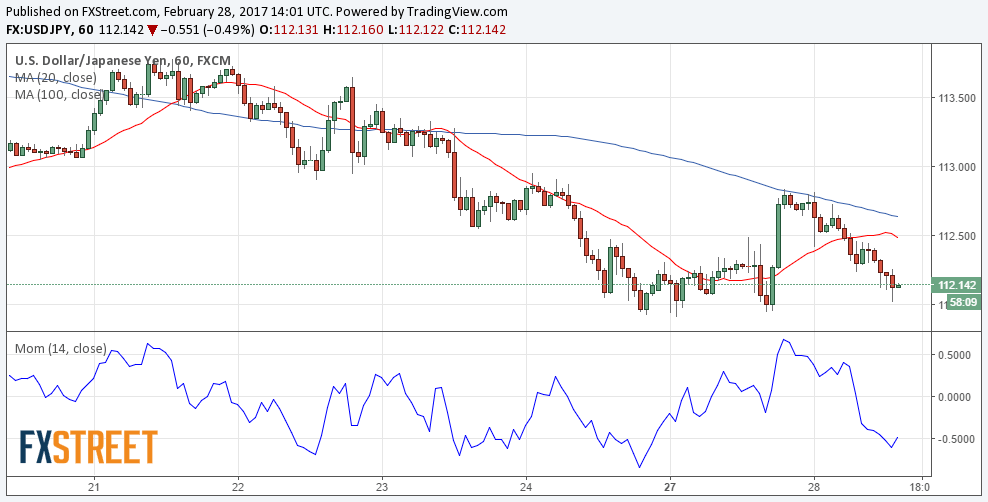
Save haven yen keeps advancing. The USD/JPY pair is back challenging the 112.00 region, after the US GDP revision came worse-than-expected, unchanged from the first estimate of 1.9%, while personal consumption indicators also missed expectations for the same period. The yen founds demand on its safe-haven condition, amid the ongoing uncertainty in Europe and the US. The short term picture maintains the risk towards the downside, as in the 1 hour chart, the price keeps retreating from a bearish 100 SMA, whilst the RSI indicator heads south around 36, and the Momentum indicator also stands near oversold readings, but with limited downward strength. In the 4 hours chart, the price is also far below its moving averages, whilst technical indicators hold within negative territory, with the Momentum indicator aiming higher, but the RSI indicator anticipating further slides, particularly on a downward acceleration below 111.95, a strong Fibonacci support.
Support levels: 111.95 111.60 111.20
Resistance levels: 112.50 112.90 113.30
Author

Valeria Bednarik
FXStreet
Valeria Bednarik was born and lives in Buenos Aires, Argentina. Her passion for math and numbers pushed her into studying economics in her younger years.


