EUR/USD Triangle Pattern after Bearish ABC Zigzag

Meta description:
The EUR/USD made a bullish bounce at the support trend line and triangle chart pattern, which is a key decision zone for a bull reversal or bear breakout.
EUR/USD
4 hour
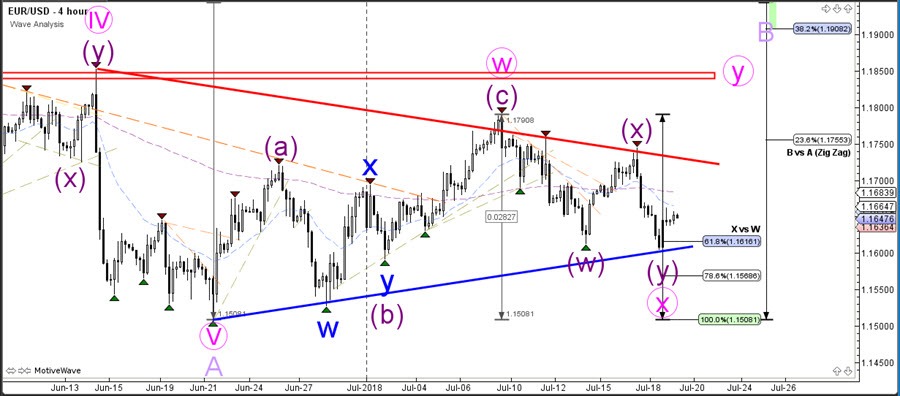
The EUR/USD made a bullish bounce at the support trend line and triangle chart pattern, which is a key decision zone for a bull reversal or bear breakout.
The wave patterns indicated in the image are expecting a bullish bounce as part of a WXY (pink) correction. A bearish breakout could still be part of an expanded wave X (pink) unless price shows strong bearish momentum, which could indicate a bearish breakout and trend.
1 hour
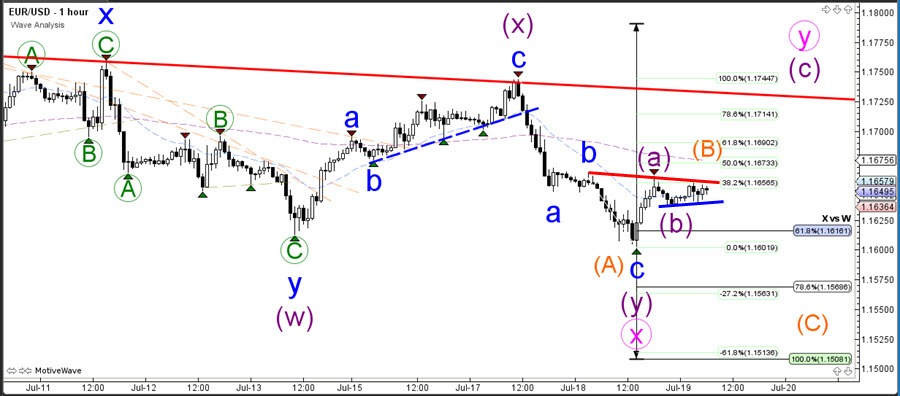
As an exception, the EUR/USD 1 hour chart offers two scenarios where both a bearish and bullish ABC pattern could be taking place. The breakout direction could indicate which ABC pattern might prevail although traders need to watch out for false breakouts as well.
Author

Chris Svorcik
Elite CurrenSea
Experience Chris Svorcik has co-founded Elite CurrenSea in 2014 together with Nenad Kerkez, aka Tarantula FX. Chris is a technical analyst, wave analyst, trader, writer, educator, webinar speaker, and seminar speaker of the financial markets.


