EUR/USD: The downfall is in the data – one chart shows more falls may come
- EUR/USD has been falling persistently, hitting the lowest in two years.
- Economic data – and disappointments – explain the move.
- FXStreet's Surprise Index chart shows an unfavorable future for the currency pair.

It is often hard to see the forest from the trees – especially in the age of constant Twitter updates, breaking news headlines, and a continuous inflow of economic data.
Why is EUR/USD falling? Politics are messy in both the US and Europe, both the Federal Reserve and the European Central Bank are easing monetary policy, and data has disappointed on both sides of the Atlantic. Negative results in all major economies explain central banks' dovishness.
But there is a difference between weak US economic figures and euro-zone ones – and especially in surprises comparing to expectations. That is where FXStreet's Surprise Index comes into play.
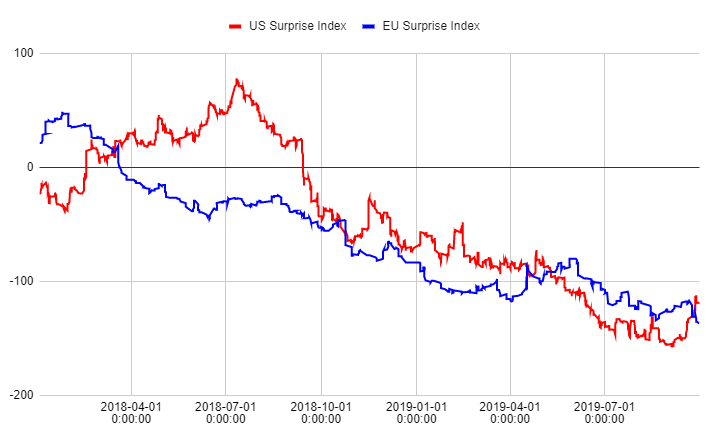
The blue line represents surprises in euro area data and the red one surprises in US figures. The chart shows that both are on a downward trajectory – triggering easing from central banks.
However, while the downtrend in European figures is maintained, there are tentative signs of a turnaround in American statistics. The FXStreet Surprise Index for US data has broken above the one for European figures.
The divergence of these indexes – while unaccompanied by central bank divergence – implies that EUR/USD still has more room to the downside.
How low can it go? The next technical levels to the downside are 1.0820, 1.0780, 1.0720, and 1.0650. Far below, the multi-decade low of 1.0340 is still far.
About the FXStreet Surprise Index
The indicator helps separate news from noise.
FXStreet Surprise Index quantifies, in terms of standard deviations of data surprises (original releases vs. survey median), the extent to which economic indicators exceed or fall short of consensus estimates.
Economic reports with better- or worse-than-expected news are assigned a positive or negative deviation value, while reports meeting expectations get a 0 deviation value. Adding up the values of the deviations, and you get an initial series showing how economic data are progressing relative to the consensus forecasts of market economists. The deviation formula employs a ratio function to replicate behavioral anchors of market participants.
Preserving the properties of these underlying series, the index finally shows the detrended momentum of the surprises in relation to previous weeks.
Surprise Indexes are constructed for the United States, Euro Area, Germany, United Kingdom, Canada, Japan, Australia and New Zealand.
Author

Yohay Elam
FXStreet
Yohay is in Forex since 2008 when he founded Forex Crunch, a blog crafted in his free time that turned into a fully-fledged currency website later sold to Finixio.


