EUR/USD surges on dovish Fed signals and shifting expectations

The EUR/USD pair rallied sharply to 1.1735 on Friday, propelled by a sustained sell-off in the US dollar. The move followed a widely anticipated Federal Reserve rate cut, which was accompanied by guidance that proved more accommodative than markets had expected.
Chair Jerome Powell explicitly ruled out further rate hikes, and the Fed's updated "dot plot" projections now indicate only one additional cut for 2026 – a more measured path of easing than previously anticipated.
Adding to dollar weakness, the Fed announced it would begin purchasing short-term Treasury bills to bolster banking system liquidity – a measure that pushed Treasury yields lower. This was compounded by economic data showing initial jobless claims rose last week at their fastest pace in nearly four and a half years, reinforcing the case for a more supportive policy stance.
The broader external environment is turning increasingly unfavourable for the greenback. While the Fed signals a slower pace of easing, markets are concurrently pricing in a relatively tighter policy trajectory for central banks in Australia, Canada, and the Eurozone. This divergence has driven the dollar lower against most major currencies this week, with its most pronounced decline coming against the euro.
Technical analysis: EUR/USD
Four-hour chart
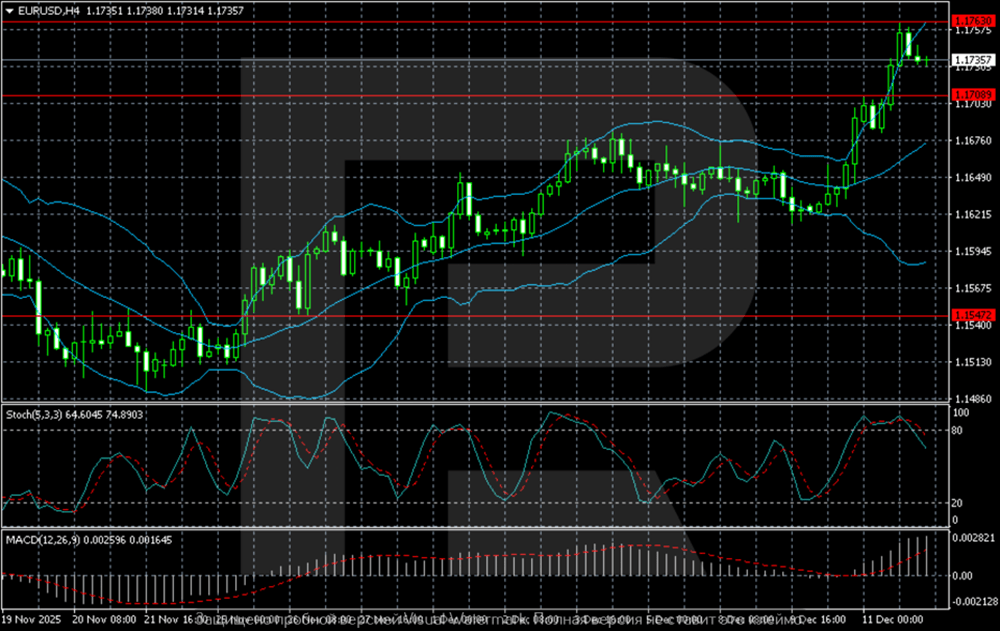
On the H4 chart, EUR/USD exhibits a robust bullish trend, trading near a key resistance zone at 1.1760–1.1780. The pair is holding firmly above the middle Bollinger Band, confirming buyer dominance. The upward slope and gradual widening of the upper band signal rising volatility and sustained momentum following a breakout to new highs.
Provided the price remains above the 1.1709 support, the market retains strong potential to challenge the 1.1780 ceiling. A decisive breakout and close above this zone would open a clear path towards 1.1850. Should a pullback materialise, the nearest significant support lies at 1.1650, the previous breakout point. A break below 1.1547 would be required to signal a deeper correction towards the lower Bollinger Band.
One-hour chart
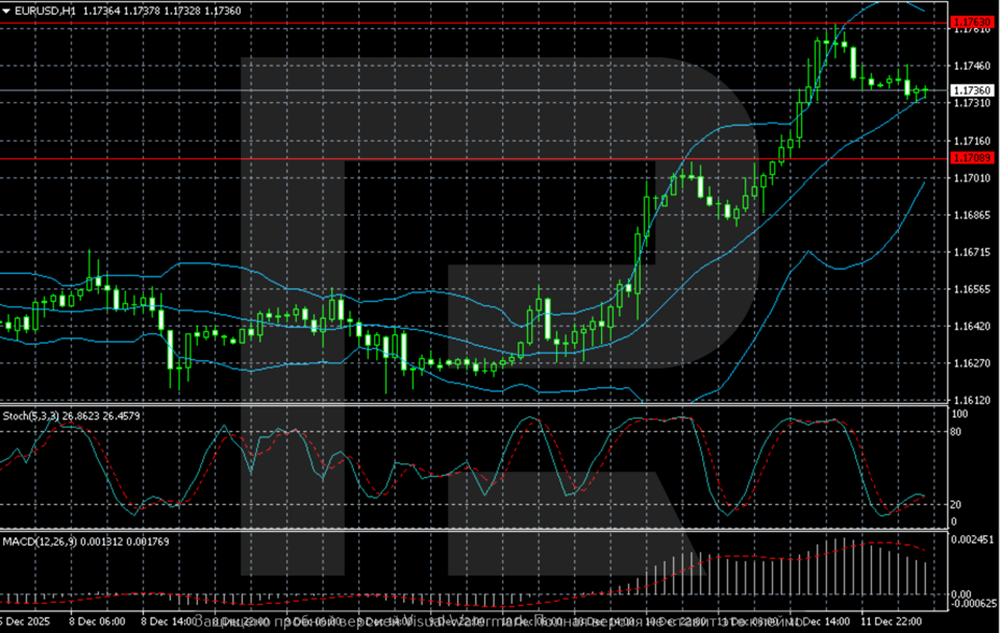
On the H1 chart, the pair is consolidating after a powerful impulse wave that targeted the 1.1760–1.1780 resistance area. The current correction is finding initial support at 1.1709, a level from which the latest acceleration originated.
The Stochastic oscillator is declining from overbought territory, increasing the probability of a near-term pause or shallow pullback. Nevertheless, the underlying structure remains bullish, with the price trading above the middle Bollinger Band, which now serves as dynamic support.
A confirmed breakout above 1.1780 would signal a continuation of the uptrend, with subsequent targets at 1.1820 and 1.1850. Conversely, a sustained move below 1.1709 would provide the first technical indication of fading bullish momentum, potentially triggering a correction towards the next demand zone in the 1.1650–1.1620 range.
Conclusion
EUR/USD has broken out decisively on the back of a dovish Fed pivot and a shifting global rate differential. The technical picture is firmly bullish, with the pair now testing a major resistance cluster near 1.1780. A successful breakout above this level would likely accelerate gains towards 1.1850. In the near term, the 1.1709 support is critical; holding above it keeps the immediate upward bias intact, while a break below would suggest a period of consolidation is needed before the next directional move.
Author

RoboForex Analysis Department
RoboForex
RoboForex Analysis Department provides timely market insights, expert technical analysis, and actionable forecasts across forex, commodities, indices, and equities.


