EUR/USD: The Bear is getting stronger

EUR/USD had another bearish daylast Friday. The price has kept producing bearish candles.It may go towards the South further since the previous swing low still has some pips to offer to the sellers. The pair started this week with a little gap on the intraday charts. However, the price action on the intraday charts suggests that it may keep driving the price towards the downside.
Chart 1 EUR/USD Daily Chart
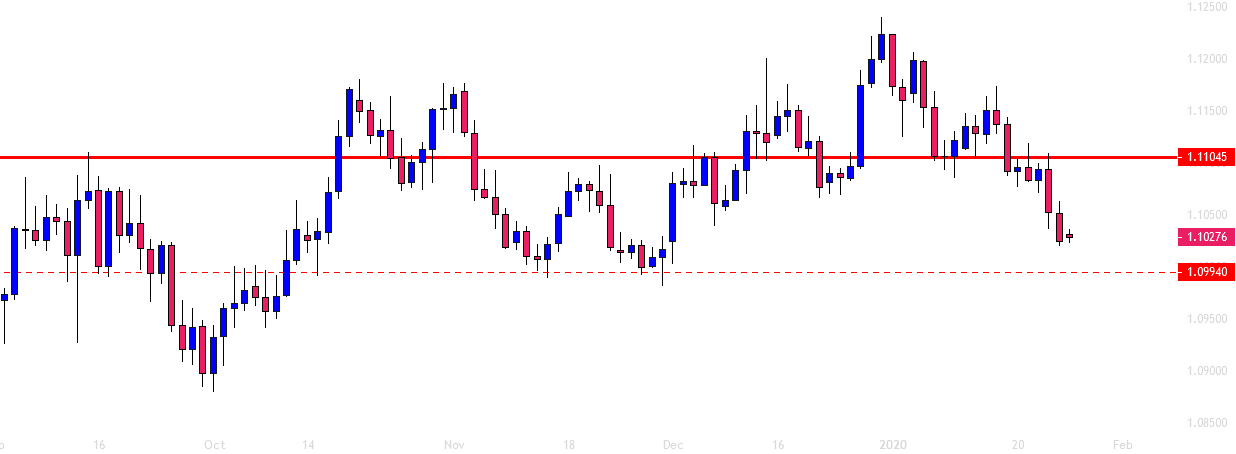
The chart shows that after being bearish, it found its support at the level of 1.11045. It then made a breakout and consolidated around the level. The chart produced a bearish engulfing candle, which was followed by another one. The price may find its next support at the level of 1.09940. Thus, the sellers on the daily chart may hold their positions until the price reaches that level. Major intraday traders may have a busy day in selling the pair. Let us have a look at two major intraday charts.
Chart 2 EUR/USD H4 Chart
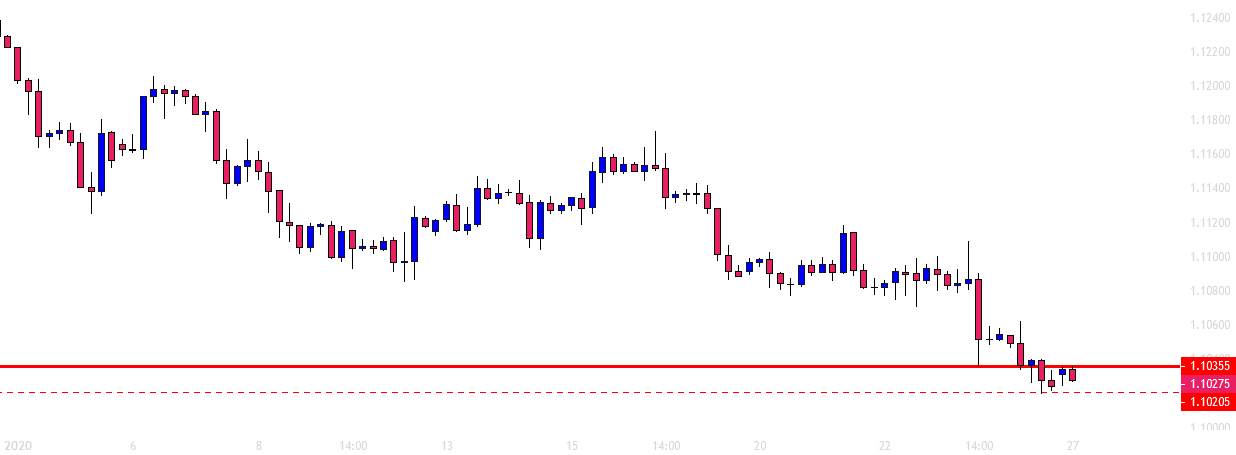
The chart shows that the price has been in consolidation. The level of 1.10355 may work as the level of resistance. If a bearish engulfing candle closes below the level of 1.10205, the price may head towards the level of 1.09675. However, the price may consolidate around the level of 1.09930 since it is a level of daily support. On the other hand, if the price makes a bullish breakout on the H4 chart, it may head towards the 1.10645.
Chart 3 EUR/USD H1 Chart
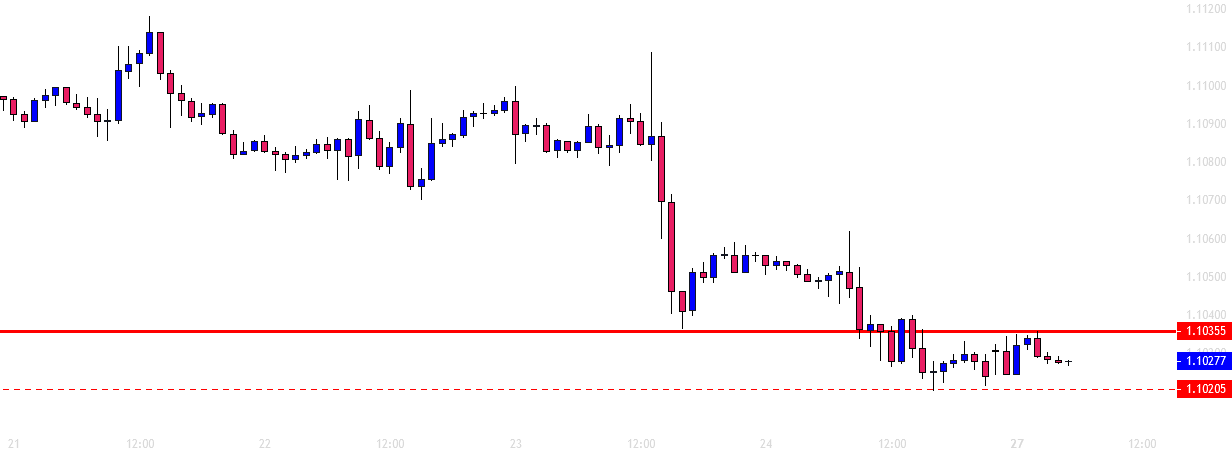
The H1 chart looks more bearish than the last time when it consolidated. The level of 1.10355 has been working as the level of resistance. It has already produced a bearish engulfing candle. If the price breaches the level of 1.10205, the sellers may go short on the pair and drive the price towards the level of 1.09930 with good bearish momentum. The sellers may notice that both the H4 and the H1 chart obeying the same level of support and resistance. This means a breakout at either side may generate good momentum. So, it is more likely that the bear may dominate and make a breakout at the level of support. The daily, the H4, and the H1 charts look good for the bear. Since these three charts are bearish biased, the pair may make another bearish breakout at the daily chart's support. If that happens, the pair is going to remain bearish for a while on the daily chart.
Author

EagleFX Team
EagleFX
EagleFX Team is an international group of market analysts with skills in fundamental and technical analysis, applying several methods to assess the state and likelihood of price movements on Forex, Commodities, Indices, Metals and


