EUR/USD – Reward for Bears

During the recent days, the euro extended losses against the greenback, which took EUR/USD to December 2017 lows and one more important support. What does it mean for the sellers?
EUR/USD – Bears vs. Retracement
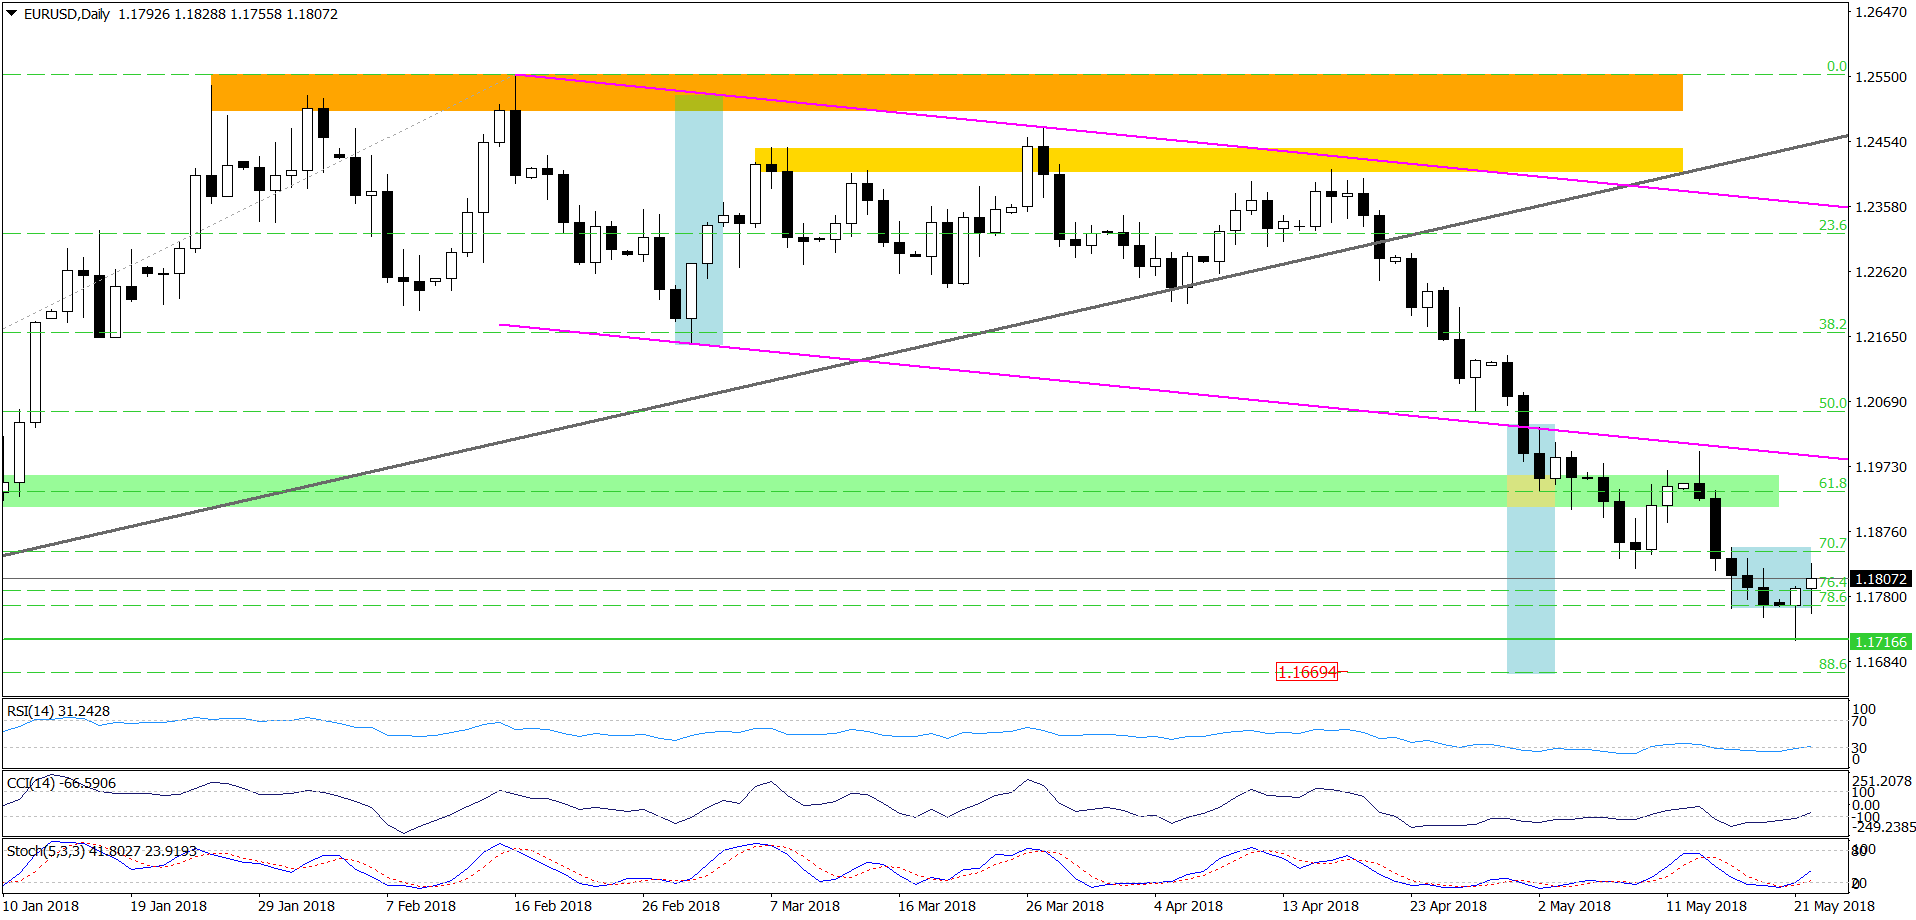
Last Thursday, we wrote that (…)If (…) the pair drops once again, we’ll likely see a test of the mid-December lows (around 1.1732) in the coming day(s). (…)
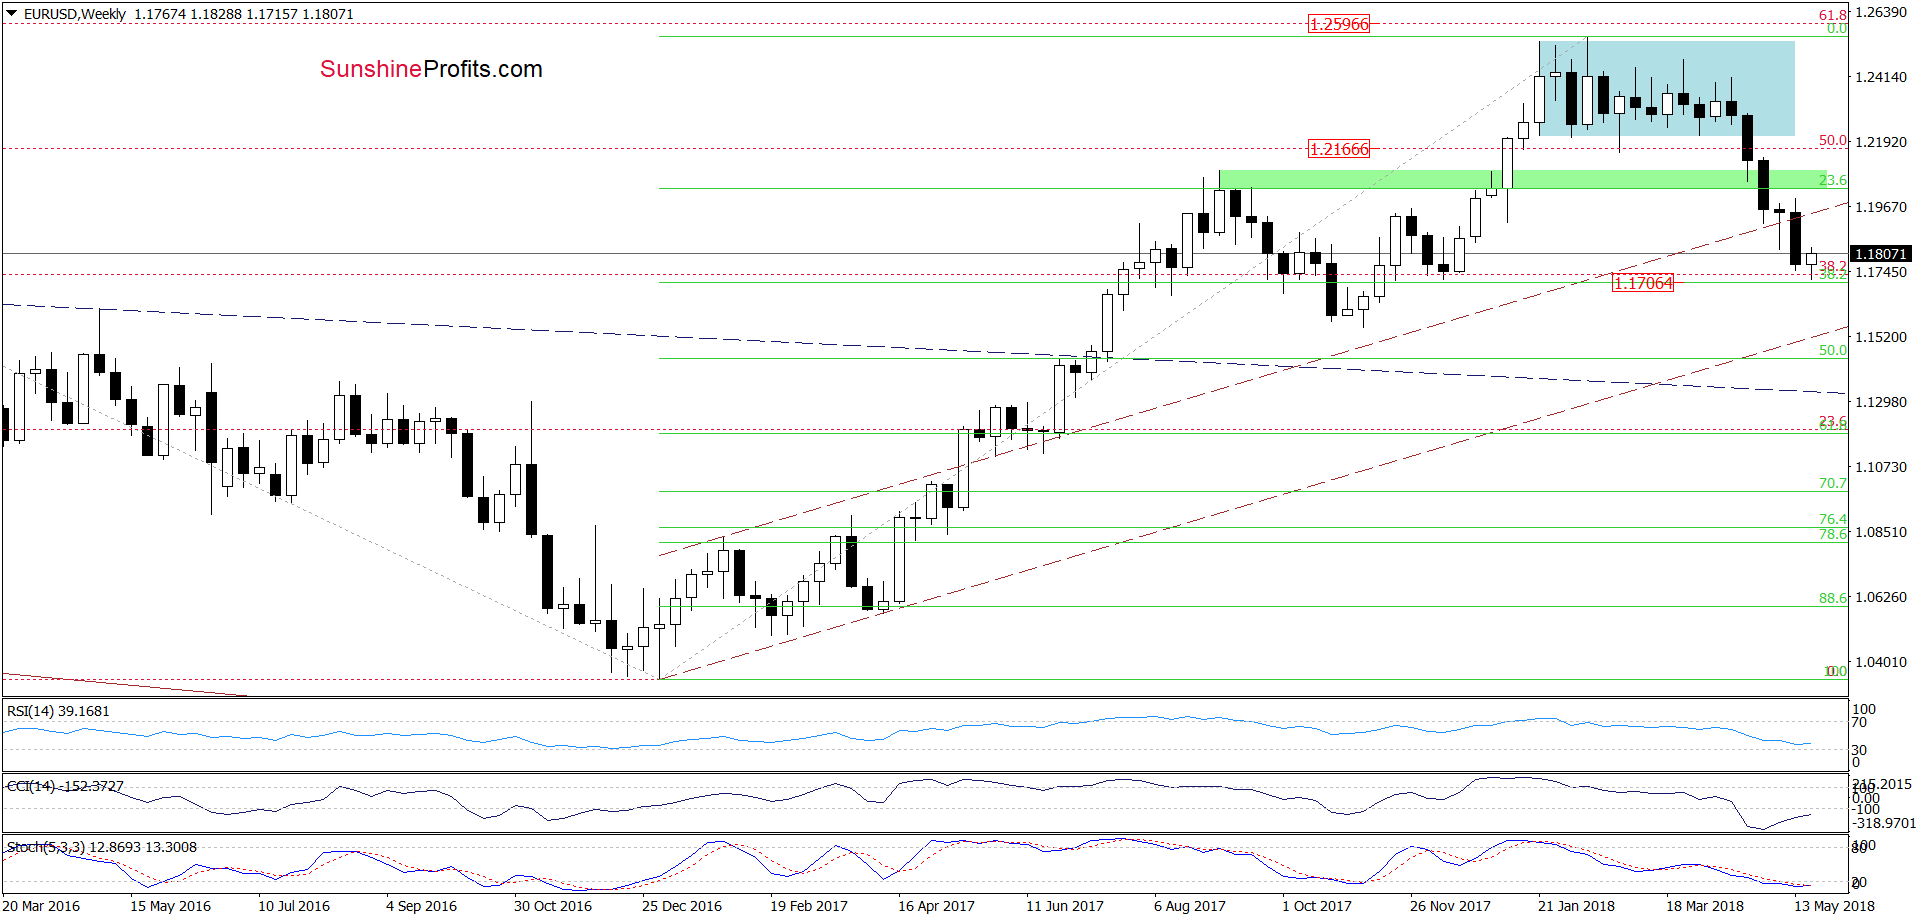
From today’s point of view, we see that the situation developed in line with the above scenario and EUR/USD slipped to our downside target. Thanks to yesterday’s drop, the exchange rate also approached the 38.2% Fibonacci retracement (as seen on the weekly chart below), which encouraged currency bulls to act.
Additionally, all daily indicators generated buy signals, increasing the probability of further improvement in the coming days. Taking all the above into account, we believe that closing short positions and taking profits off the table is justified from the risk/reward perspective (as a reminder, we opened them a week ago when EUR/USD was trading at around 1.1919).
GBP/USD – Sellers Meet Support
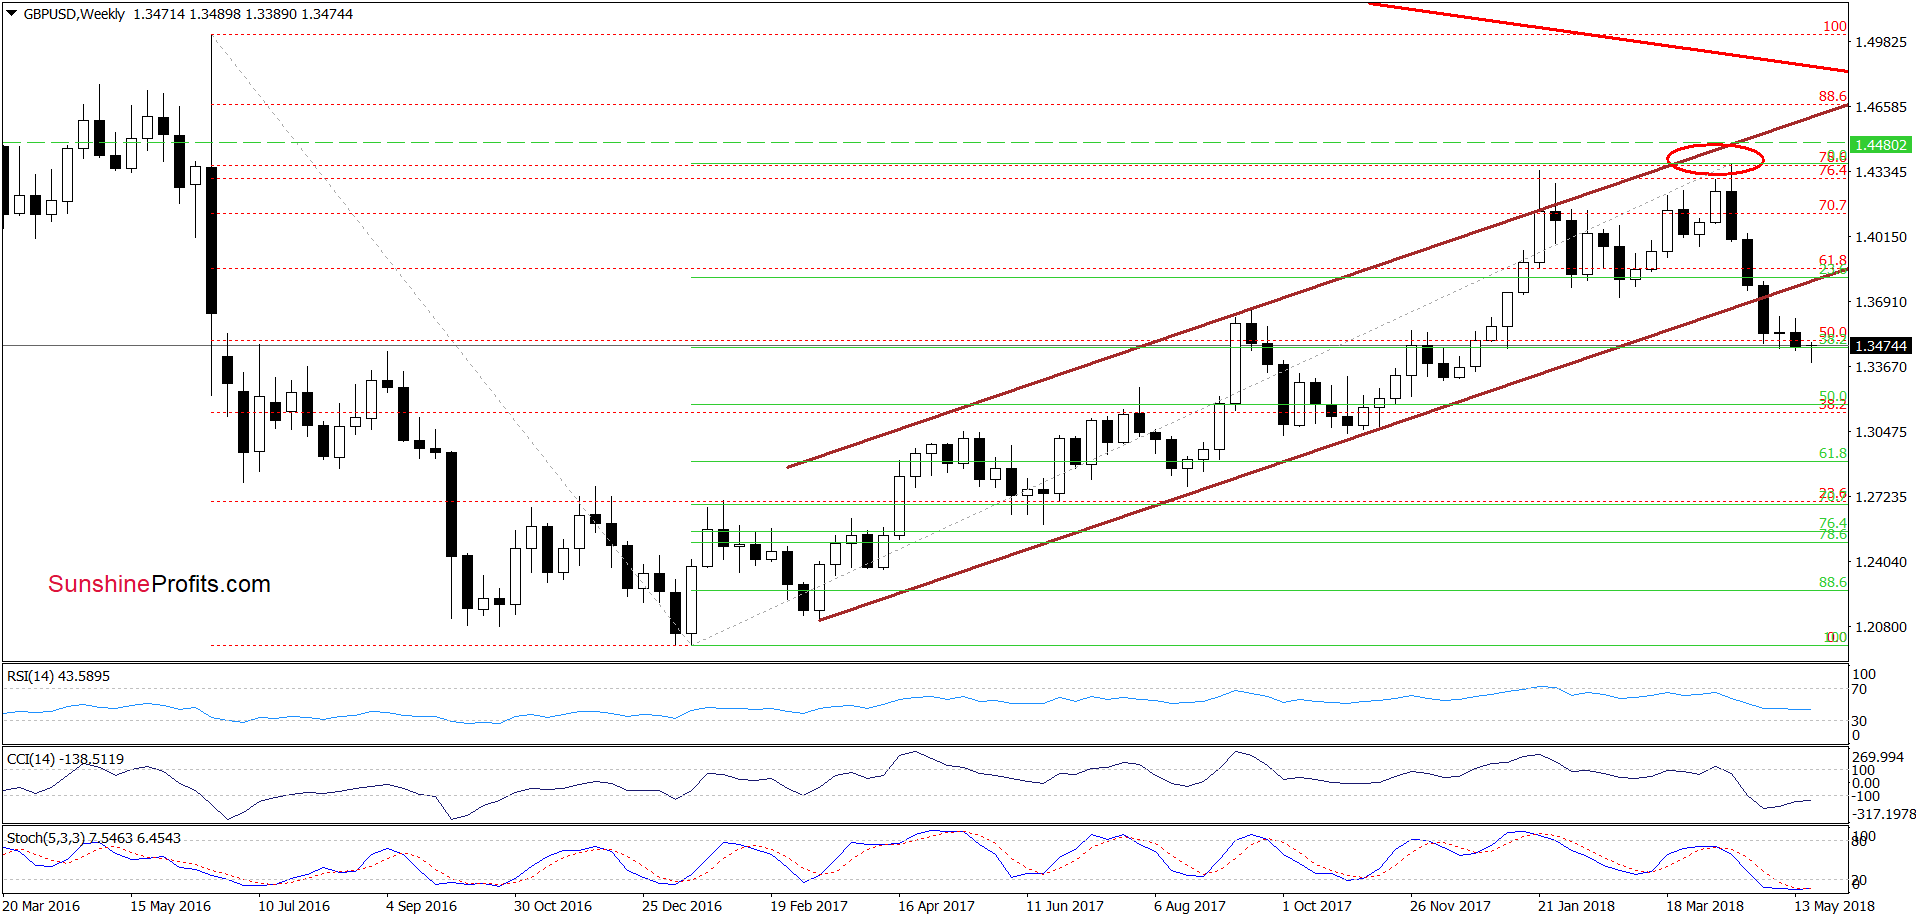
Looking at the medium-term chart, we can notice some similarity to what we already saw in the case of EUR/USD. What do we mean by that? As you can see, GBP/USD also moved to the 38.2% Fibonacci retracement, which in combination with the current situation in the very short term suggests that higher values of the exchange rate are just around the corner.
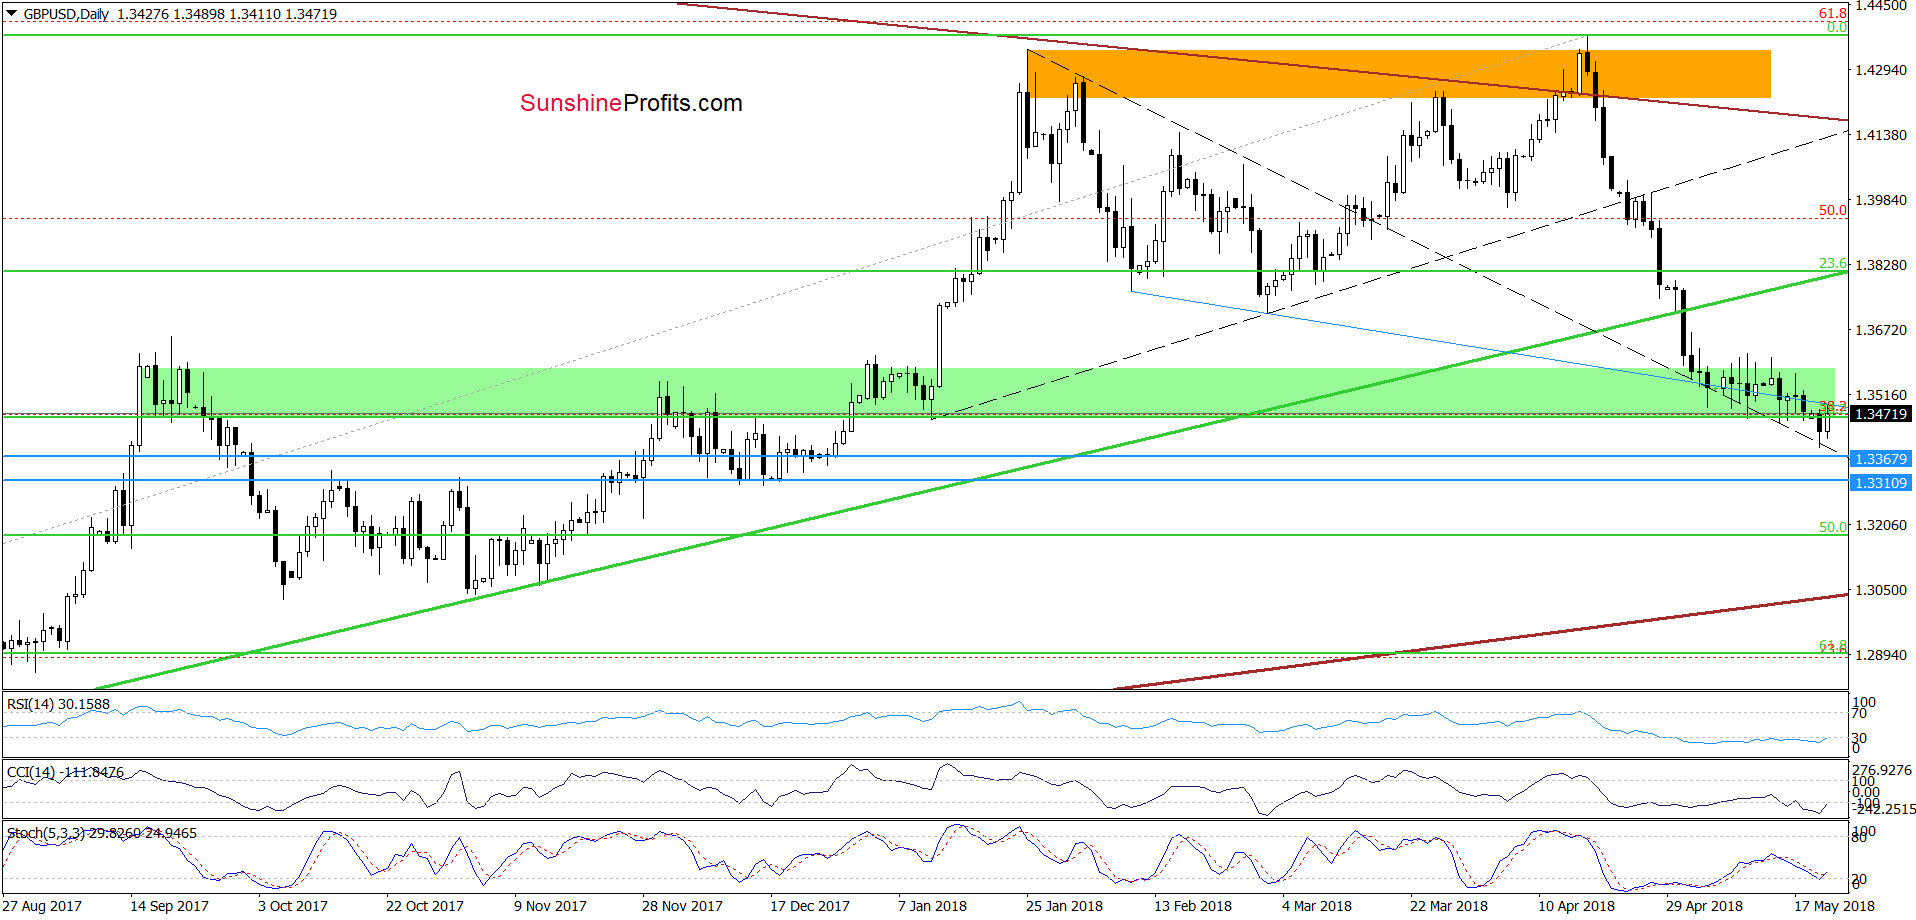
From today’s point of view, we see that although the pair slipped under the green support zone, the above-mentioned 38.2% Fibonacci retracement (based on the entire 2017-2018 upward move) together with the upper line of the black triangle (marked with dashed lines) stopped the sellers, triggering a rebound.
Although the move is tiny (compared to the earlier declines), the current position of the daily indicators suggests that buy signals and further improvement should not surprise us in the coming days.
If this is the case and the pair moves higher from here, the first upside target will be around 1.3570-1.3616, where the early May highs are. If we see a breakout above this resistance area, we’ll consider opening long positions. We will keep our subscribers informed should anything change, or should we see a confirmation/invalidation of the above.
USD/JPY – Breakout or Fakeout?
In our last commentary on this currency pair, we wrote that (…) the buy signals generated by the indicators continue to support the buyers, which suggests that one more upswing and a test of the 61.8% Fibonacci retracement should not surprise us. Nevertheless, the current position of all daily indicators (they remain in their overbought areas) indicates that the space for gains may be limited and it’s worth to keep an eye on currency bulls’ behavior, because any show of their weakness could trigger a pullback in the coming days.
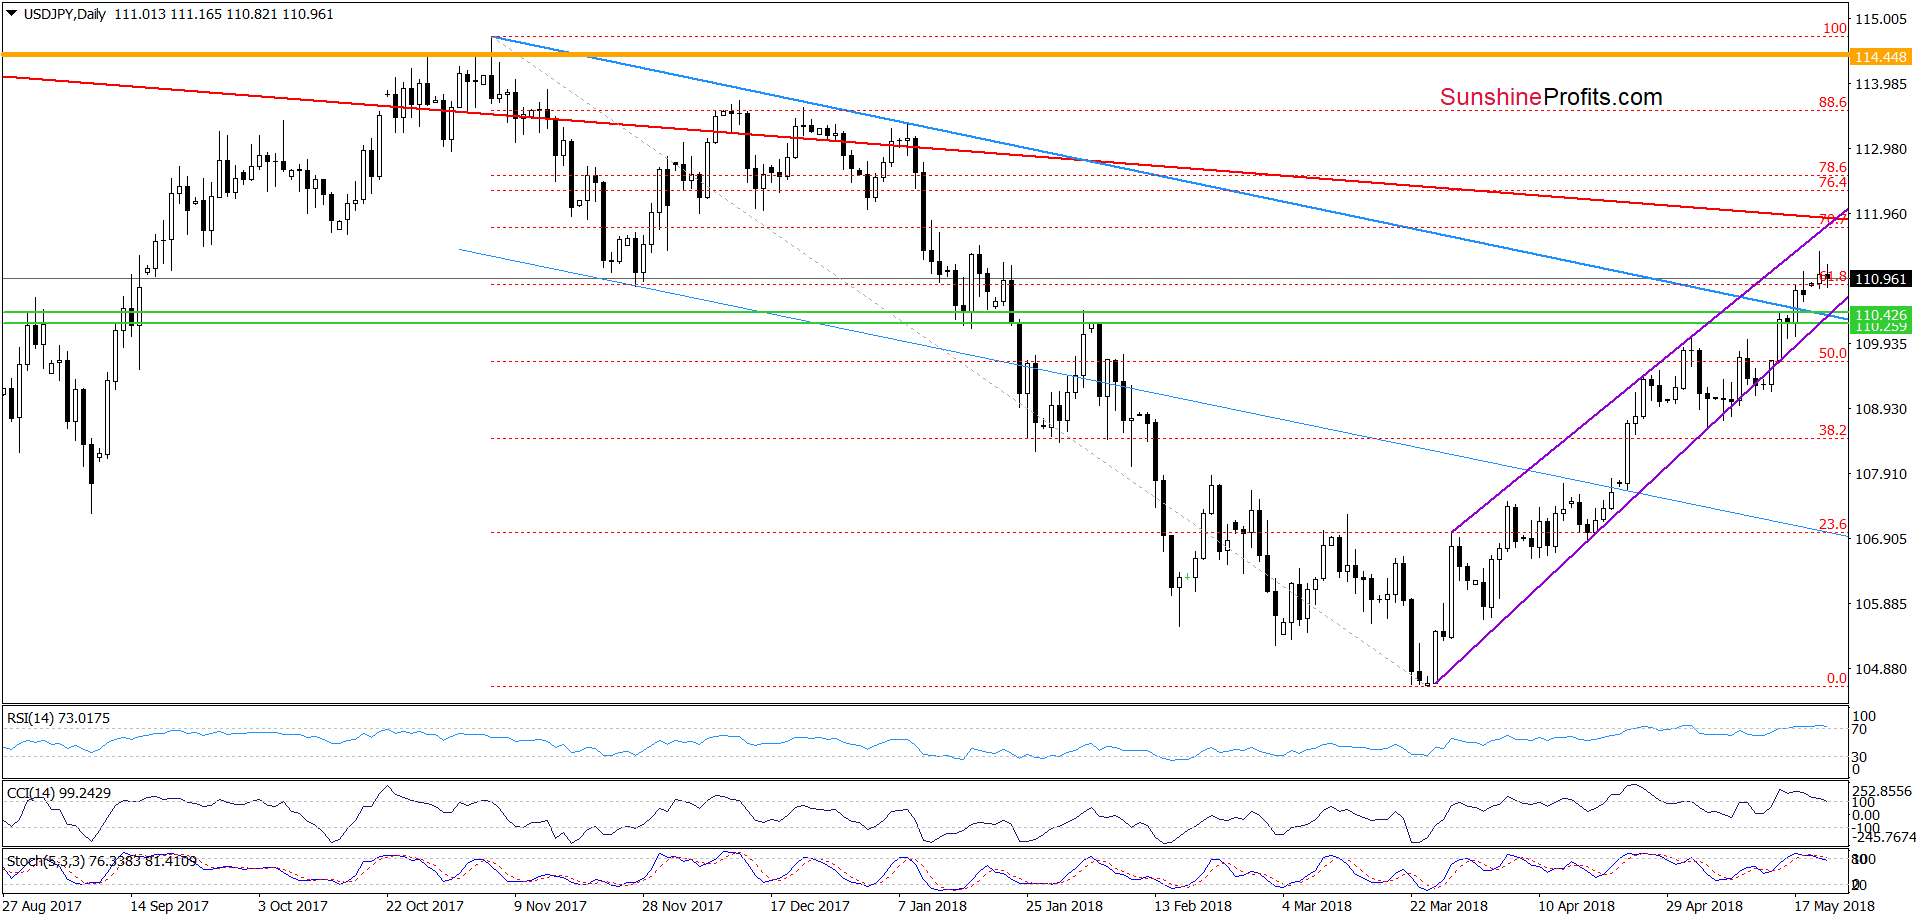
As you can see on the daily chart, currency bulls pushed the pair higher (as we had expected) and USD/JPY broke above the 61.8% Fibonacci retracement yesterday. Although this was a positive event, the proximity to the upper line of the purple rising wedge and the long-term resistance line (marked on the weekly chart below) encouraged the sellers to act earlier today.
Additionally, all daily indicators are very close to generating sell signals, increasing the probability of reversal in the very near future.
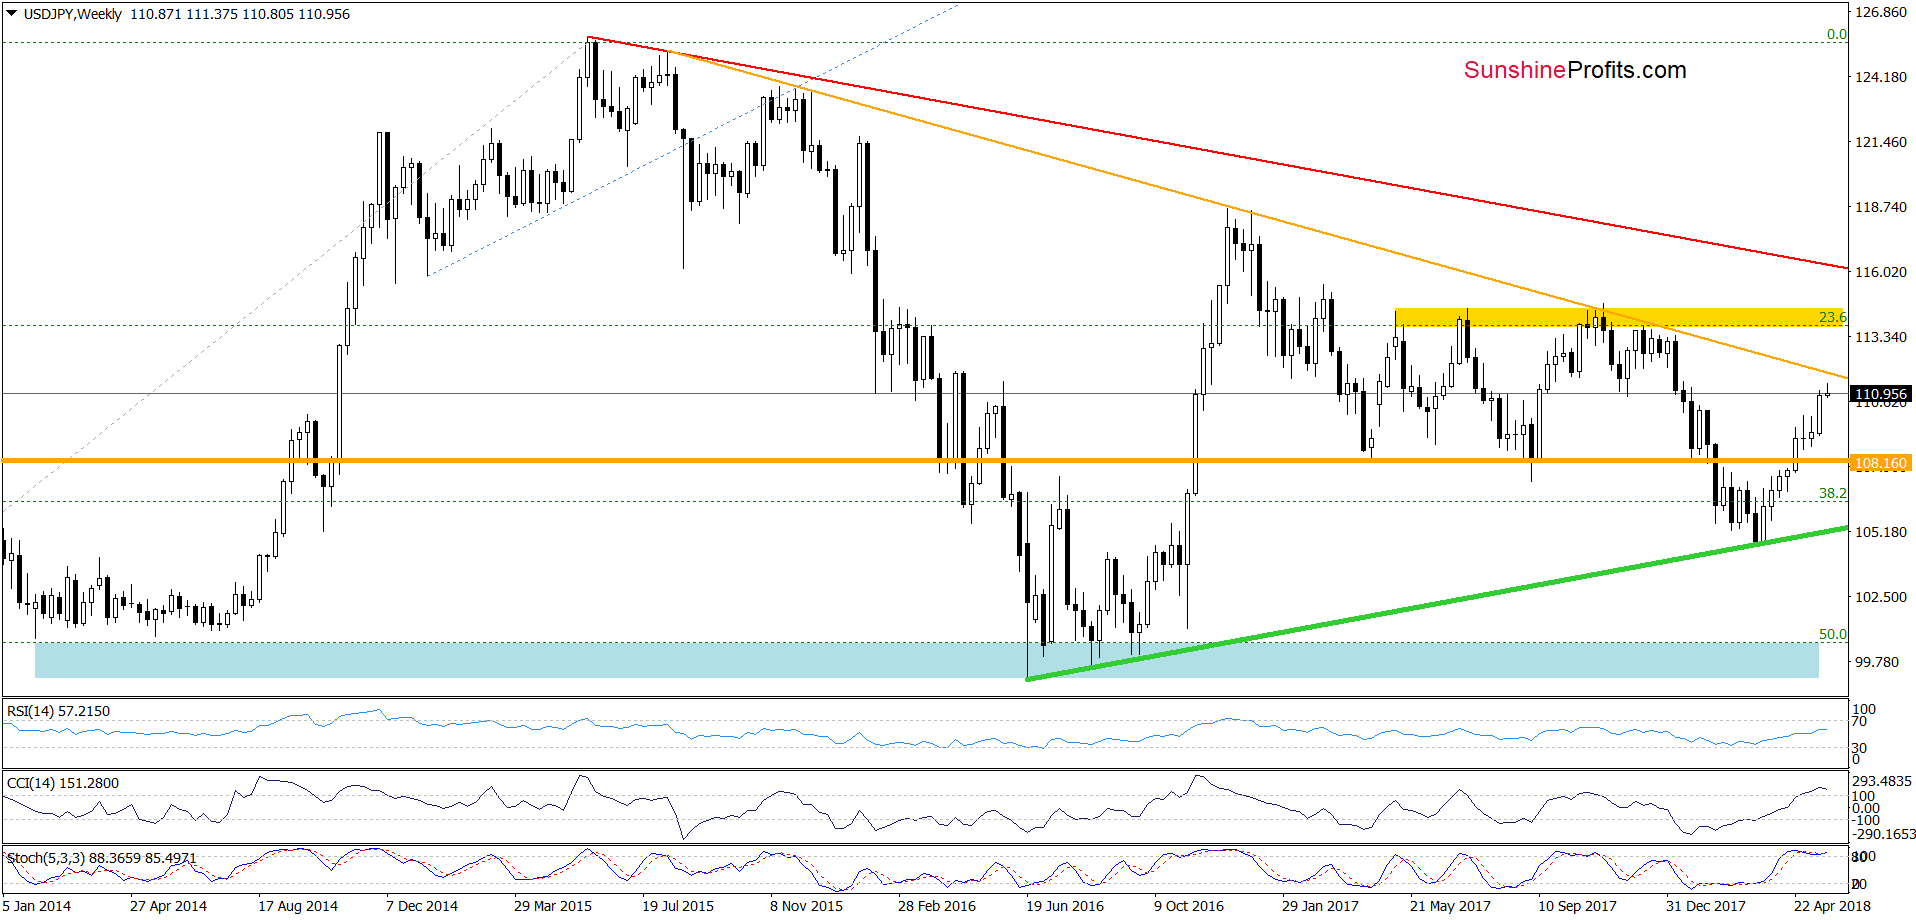
Looking at the above chart, we see that thanks to the recent increase, USD/JPY approached the orange declining resistance line, which stopped currency bulls many times in the past (in December 2016, January 2017, November 2017 and also last December).
Therefore, even if the exchange rate moves a bit higher from here, the space for rally seems limited. We will keep our subscribers informed if anything changes, or should we see a confirmation/invalidation of the above.
Want free follow-ups to the above article and details not available to 99%+ investors? Sign up to our free newsletter today!
Author

Nadia Simmons
Sunshine Profits


