EUR/USD Price Forecast: Trump’s intervention in the Middle East spur risk aversion

EUR/USD Current price: 1.1470
- US President Donald Trump launched attacks on Iran over the weekend.
- Iranian authorities decided to close the Strait of Hormuz.
- EUR/USD pressures the 1.1450 region, aims for a bearish breakout.
The EUR/USD pair gapped lower at the weekly opening, finding intraday buyers in the 1.1450. The following advance was enough to fill the gap, with the pair resuming its decline afterwards and trading near a fresh low of 1.1453. Fears arose amid United States (US) President Donald Trump's intervention in the Middle East crisis. The US attacked critical Iranian nuclear locations at Fordow, Natanz and Isfahan over the weekend, with Trump reporting the US “completely and totally obliterated” key nuclear enrichment facilities.
As a result, Iranian authorities decided to close the Strait of Hormuz, the only sea passage from the Persian Gulf to the open ocean, critical as a large portion of the world’s oil and gas passes through it. Tehran's Major General Kowsari tweeted: “The Parliament has reached the conclusion that the Strait of Hormuz should be closed, but the final decision in this regard lies with the Supreme National Security Council.”
Other than that, the Hamburg Commercial Bank (HCOB) released the preliminary estimates of the Eurozone Purchasing Manager’s Indexes (PMI), which came in below the market expectations, but matched May’s figures. Manufacturing output held steady at 49.4 vs expectations for an uptick to 49.8. The services index printed at 50, meeting the forecast and better than the previous 49.7. Finally, the Composite PMI printed at 50.2, slightly below the 50.5 anticipated by market players.
The American session will bring the US S&P Global PMIs for the same period, and a couple of central bank speakers.
EUR/USD short-term technical outlook
Meanwhile, the daily chart for the EUR/USD pair shows that it continues to lose momentum, although a steeper decline is not yet in sight. The pair rests just above a mildly bullish 20 Simple Moving Average (SMA), providing dynamic support at around 1.1440. The longer moving averages remain far below the shorter one, with the 100 SMA still heading firmly north. Technical indicators, in the meantime, ease towards their midlines, but with limited downward strength.
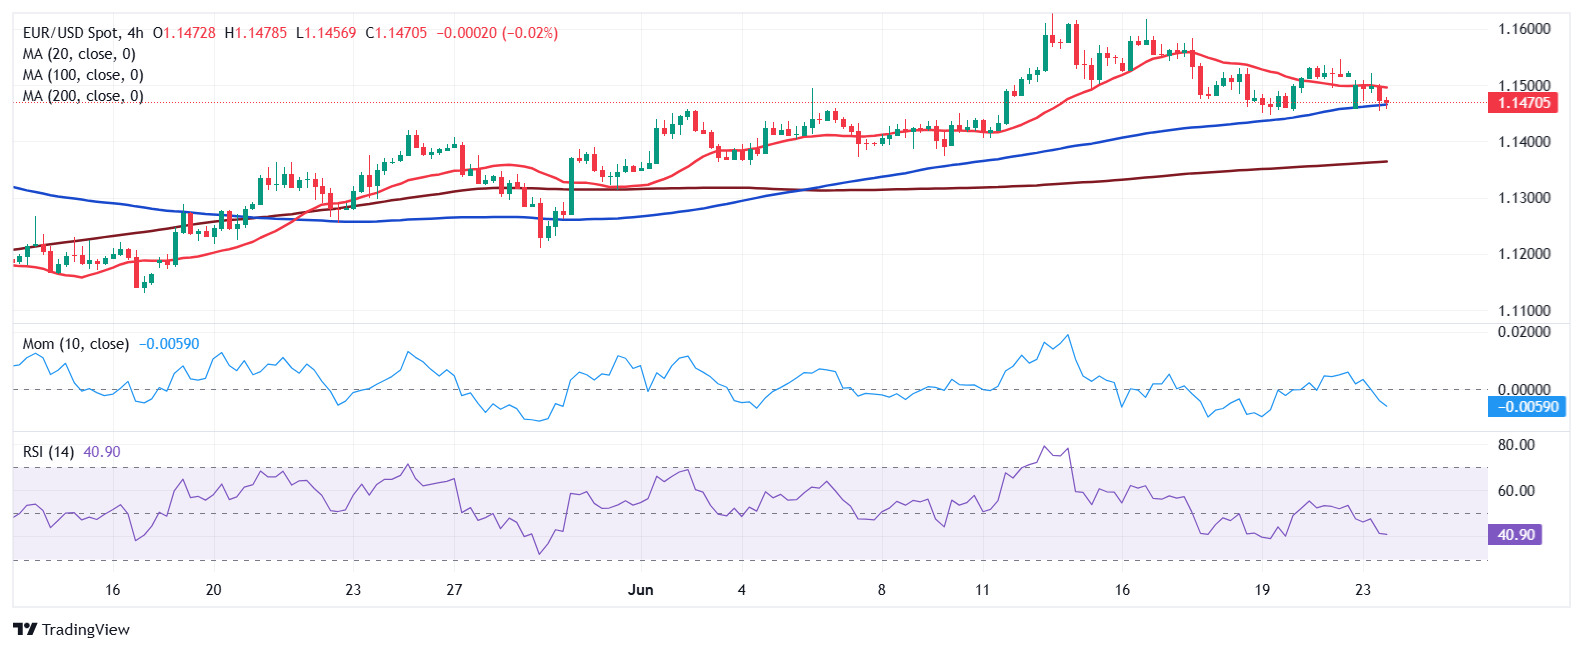
In the near term, and according to the 4-hour chart, EUR/USD is neutral-to-bearish. The pair struggles to hold above a mostly flat 100 SMA, while a mildly bearish 20 SMA contains advances. Finally, the Momentum indicator seesaws directionless around its 100 line, while the Relative Strength Index (RSI) indicator hovers around 42, favoring another leg lower without confirming it.
Support levels: 1.1425 1.1380 1.1335
Resistance levels: 1.1530 1.1580 1.1620
Premium
You have reached your limit of 3 free articles for this month.
Start your subscription and get access to all our original articles.
Author

Valeria Bednarik
FXStreet
Valeria Bednarik was born and lives in Buenos Aires, Argentina. Her passion for math and numbers pushed her into studying economics in her younger years.


