EUR/USD Price Forecast: ECB delivers as expected, US data beats expectations

EUR/USD Current price: 1.1738
- The European Central Bank left the interest rates unchanged as expected.
- S&P Global will release the preliminary estimates of the US July PMIs.
- EUR/USD easing from fresh highs, bearish potential limited in the near term.
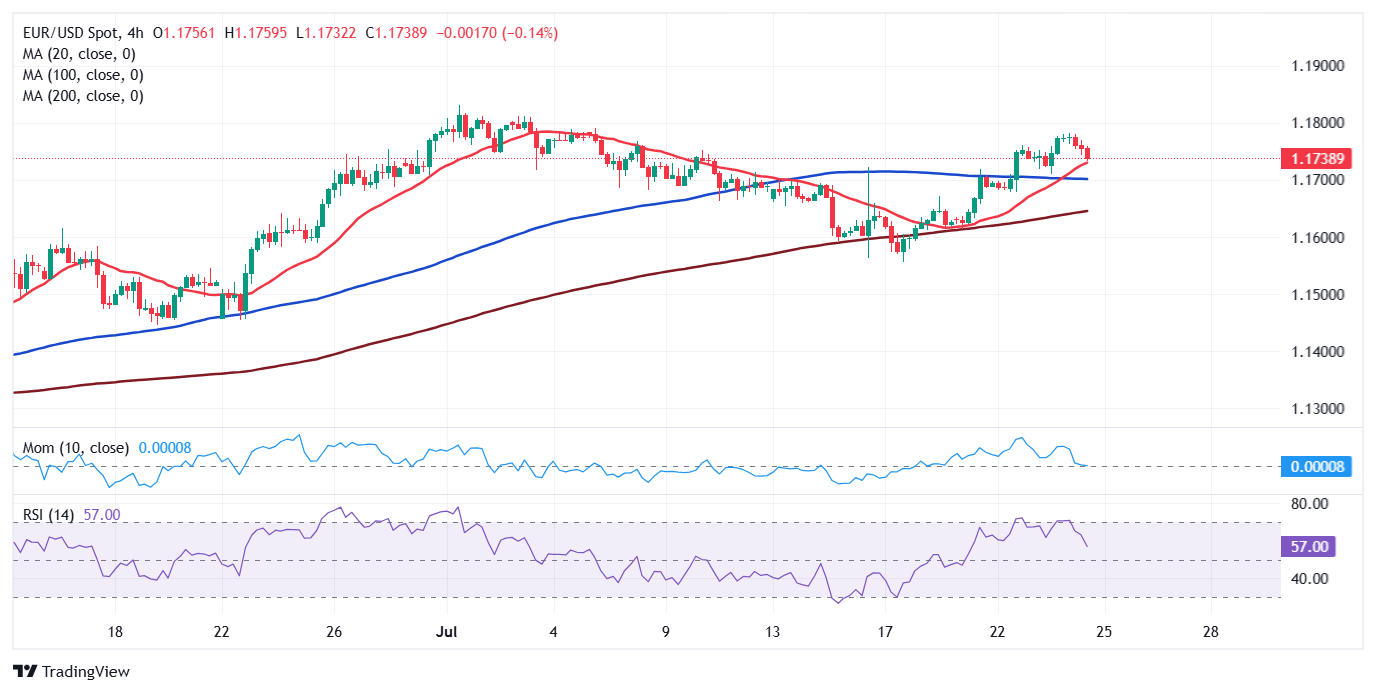
The EUR/USD pair retreated from a fresh two-week peak at 1.1781 posted during Asian trading hours, hovering around 1.1750 ahead of the European Central Bank (ECB) monetary policy announcement. The US Dollar (USD) edged lower on the back of risk appetite, amid headlines indicating a trade deal between Japan and the United States (US).
US President Donald Trump announced in a post on social media a trade deal with Japan that sets "reciprocal" tariffs at 15% on Tuesday, while Japanese Prime Minister Shigeru Ishiba acknowledged the trade agreement on Wednesday, saying it would benefit both sides. Trump shifted his attention to the European Union (EU), noting that if the Union agrees to open up to US businesses, he will then charge lower levies.
Meanwhile, the Hamburg Commercial Bank (HCOB) published the preliminary estimates of the July Purchasing Managers’ Indexes (PMIs). European growth stands at its highest in almost a year according to the surveys, as the Composite PMI rose to 51.0 in July from 50.6 in Jun,e while beating expectations of 50.8.
As for the ECB, the central bank announced its decision to keep the benchmark rates on hold, as widely anticipated. The interest rate on the main refinancing operations, the interest rates on the marginal lending facility and the deposit facility stood at 2.15%, 2.4% and 2%, respectively. The headline had no impact on EUR/USD, which kept trading at around 1.1750.
Right afterwards, the US released Initial Jobless Claims for the week ended July 19, which improved to 217K from the 221K previously posted and the 227K anticipated. Coming up next is ECB President Christine Lagarde's press conference, and the US S&P Global preliminary July PMIs.
EUR/USD short-term technical outlook
From a technical point of view, the daily chart for the EUR/USD pair shows it is under mild selling pressure, but with limited bearish scope. The pair holds above a flat 20 Simple Moving Average (SMA), providing dynamic support at around 1.1710. The longer moving averages, in the meantime, keep heading north far below the current level. At the same time, the Momentum indicator lacks directional strength at around its 100 line, while the Relative Strength Index (RSI) indicator turned south but hovers around 59.
The 4-hour chart shows EUR/USD easing towards a bullish 20 SMA at around 1.1720, which maintains its bullish slope above directionless 100 and 200 SMAs. Technical indicators, in the meantime, turned sharply lower but remain within positive levels, reflecting the ongoing slide rather than anticipating a steeper one.
Support levels: 1.1710 1.1665 1.1620
Resistance levels: 1.1780 1.1830 1.1875
Author

Valeria Bednarik
FXStreet
Valeria Bednarik was born and lives in Buenos Aires, Argentina. Her passion for math and numbers pushed her into studying economics in her younger years.