EUR/USD prepares to provide medium-term signal

EUR fell to 1.1849 on the back of a stronger USD, continuing to lose ground following FED’s dot plot. The said level was reached during Friday’s session, adding to the previous days’ losses and testing another Fibonacci retracement level. The overall scope remains biased to the downside, projected from support at the local market low of 1.19683.
With EURUSD moving down impulsively, bears could be heading to complete a 5W move in (C) of ④. Should prices drop to wave (A)’s levels, they would mark the end of the 5W structure as a regular flat pattern as waves (A) and (B) are 3W moves. In addition, wave (B) retraced wave (A) deeply, registering a near-90% correction seen within regular flat patterns. If the pair breaks below the support, the probabilities of forming a double zigzag instead will increase.
Let’s look at the two variations.
EURUSD Hints at Flat Correction
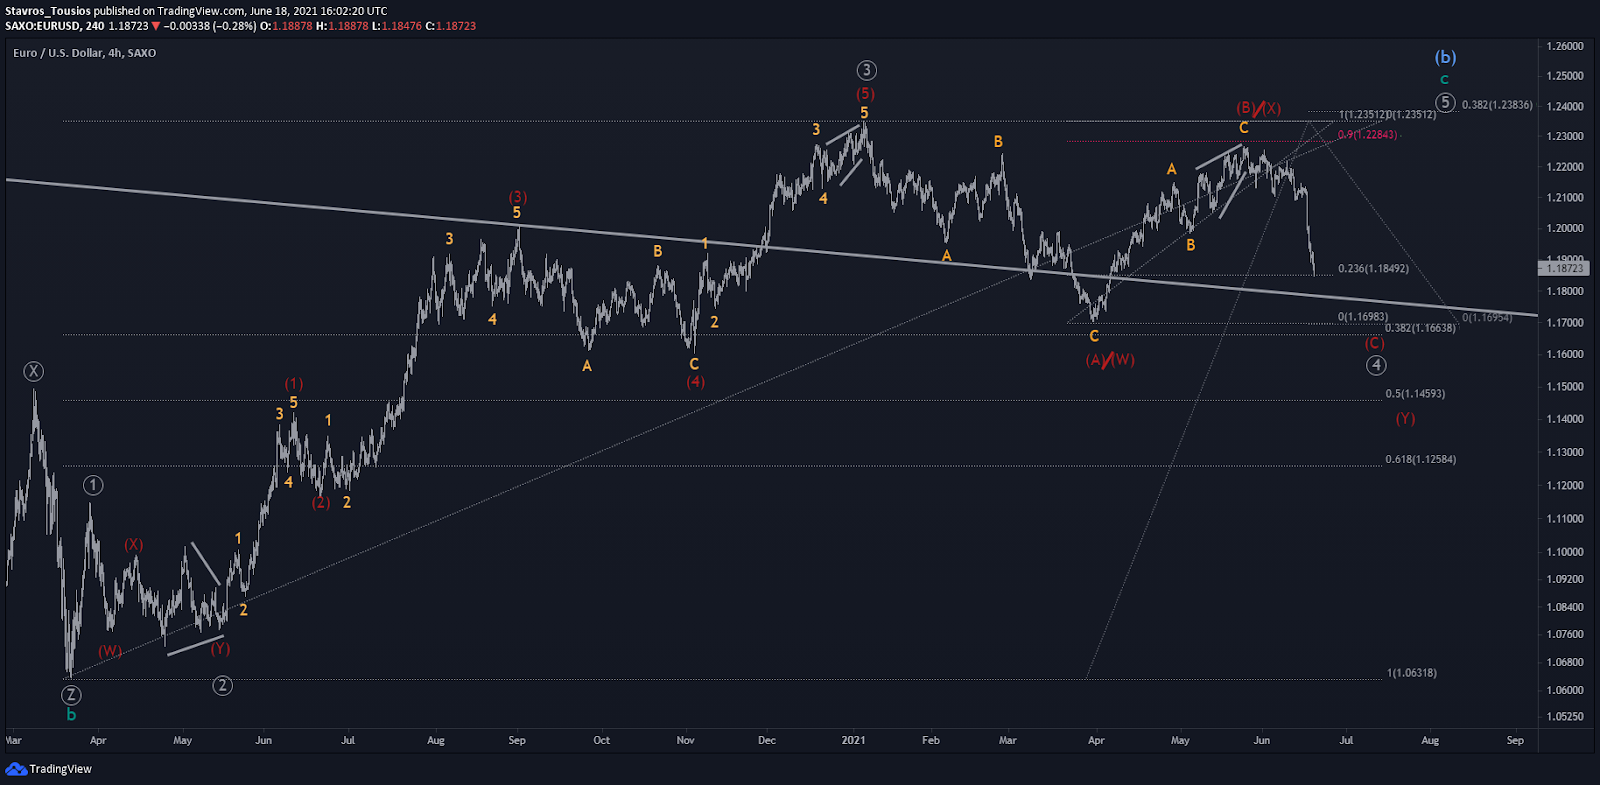
The pair is expected to end anywhere between 1.18492 and 1.16983 as a regular flat. Once the validation signals kick in in wave (C), the correction will be expected to end and the trend to resume up. The bounce will likely break the previous high registered in wave ③. However, with the 38.2% FE of ①-④ blocking the 1.23836 passage, wave c of (b) could be in for a weak run.
A double zigzag will come into the gameplan if the low breaks. In fact, it makes more sense that two 3W structures are followed by another 3W one. The projection to the downside would be more pessimistic should the break 38.2% FR of ①-③ gives in to bearish pressure as it would expose the 50%, and perhaps even the 61.8% FRs at 1.14593 and 1.12584 – respectively. However, the chances of slicing through the 1.14239 are low, as this is what holds the internal intermediate wave structure impulse intact.
Alternative Scenario Sees Bullish Ending Diagonal
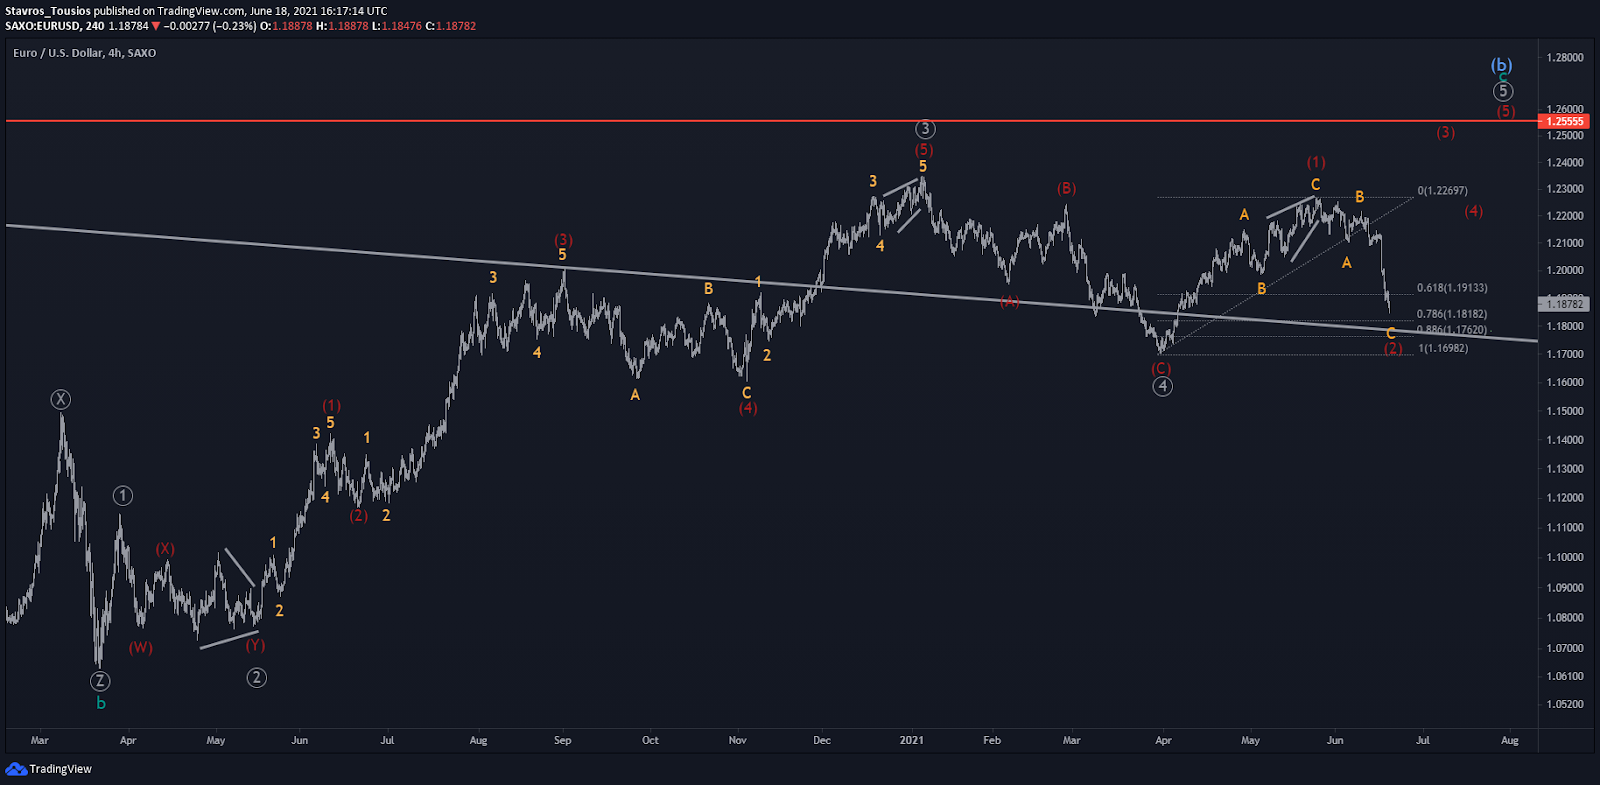
In my alternative scenario euro is expected to shift direction quite soon, down at 1.18182 or 1.17620 FR levels of wave (1) against the dollar. The alternative structure suggests that wave ④ of c ended at 1.16982 low as a simple (A)(B)(C) zigzag. However, due to the depth of the bullish structure’s retracement past the 61.80% FR and the corrective look of the upside leg, wave ⑤ is expected to form an ending diagonal.
A break past 1.2352 top will open up the way to 1.25555, the top reached by wave (a) in Feb ’18.
What Pattern Are We In In The Long Term?
In the long run, we are looking at ending wave (b) of a supercycle (a)(b)(c) structure starting in June ’08. The first leg, wave (a), found a bottom in Jan ’17, where wave (b) begun. Cycle wave a of (b) formed a 5W structure. Therefore, c is expected to end similarly.
Looking at both charts, one can notice a descending trendline connecting several tops. The said long-term resistance was broken last Nov, and prices haven’t return below it, hinting at more upside.
Perhaps, the main scenario will get valid once the support rejects bears, aligning with the expected correction levels.
Author

Stavros Tousios
Independent Analyst
Stavros is leading the Investment Research Team at a reputable Forex broker. He has been involved in the financial markets since 2014 and in cryptocurrencies trading since 2017.


