EUR/USD on the rise in sideways channel
-
EUR/USD surpasses downtrend line.
-
20- and 50-day SMA post bullish cross.
-
RSI flattens but MACD ticks up.

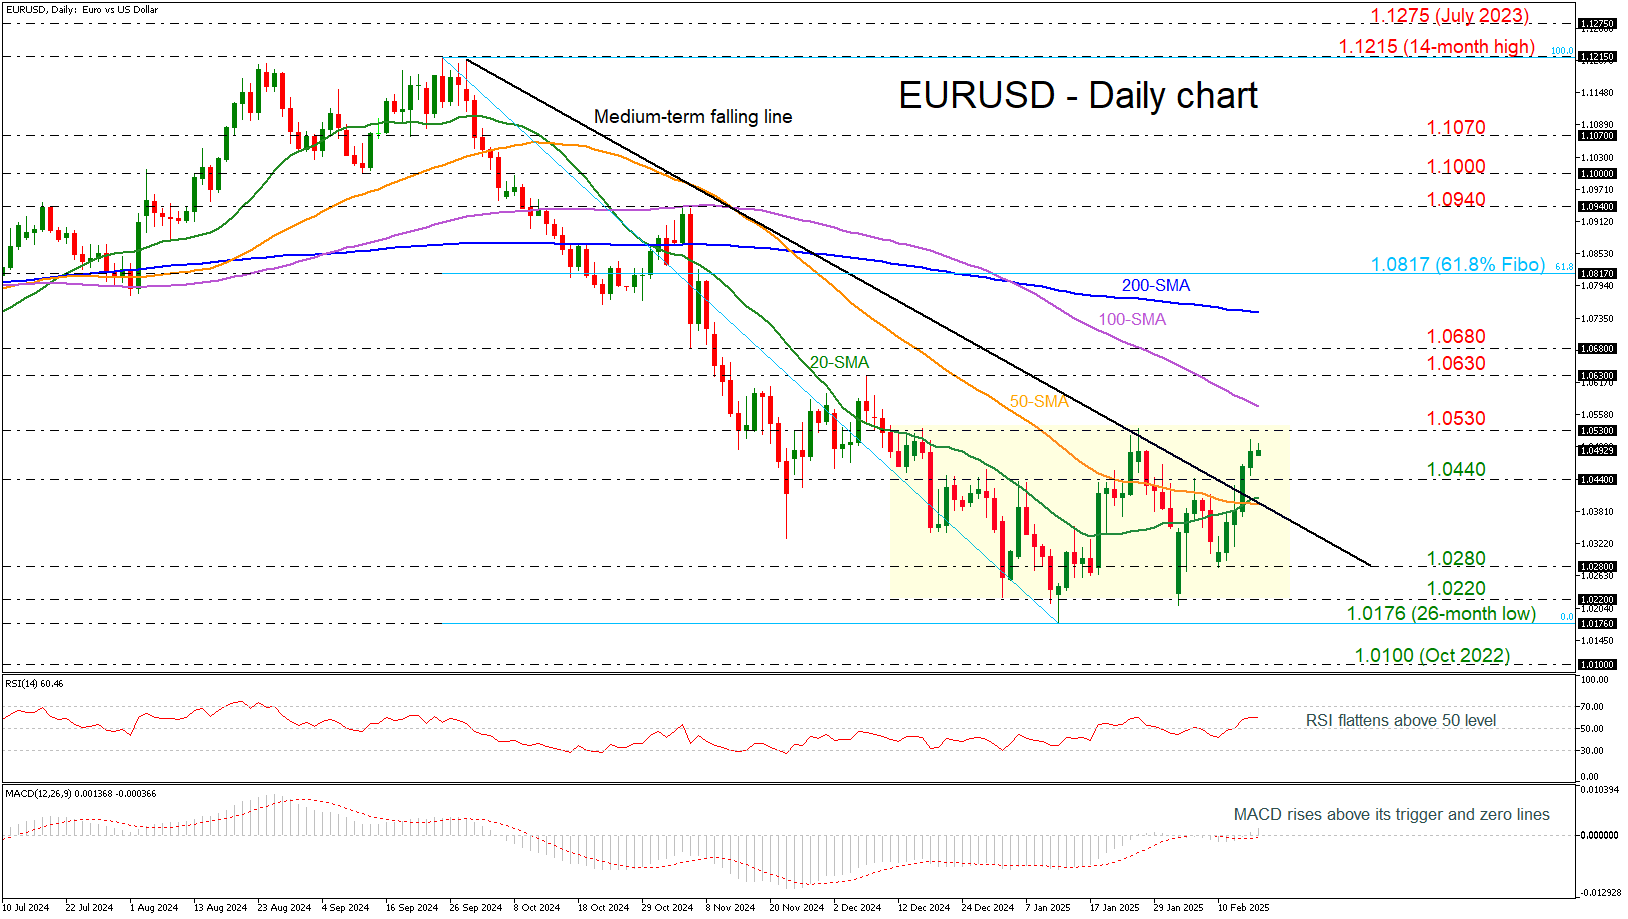
EUR/USD has advanced considerably in the short-term timeframe, recording five consecutive green days and surpassing the medium-term descending trend line. Also, the 20- and 50-day simple moving averages (SMAs) posted a bullish crossover, mirroring the latest upswing. However, the pair has still been developing within a trading range of 1.0220-1.0530 over the last two months.
In case of steeper increases and a successful break of the 1.0530 roof, then the market could find the next resistance at the 100-day SMA at 1.0570, ahead of the 1.0630–1.0680 restrictive region. Further upside movements could take the bulls towards the 200-day SMA at 1.0746 and the 61.8% Fibonacci retracement level of the down leg 1.1215-1.0176 at 1.0817, which would act as a significant turning point for the market.
Conversely, a decline below the 1.0440 support and the downtrend line, aligning with the short-term SMAs at 1.0400, could reinforce the neutral bias once more, leading to a test of the 1.0280 support. Below that, the lower boundary of the consolidation area at 1.0220 could be a tough obstacle for the bears, but penetration of this area could send investors to the 26-month low of 1.0176.
The technical oscillators are showing some neutral-to-positive vibes. The RSI is flattening above the neutral threshold of 50, while the MACD is extending its positive momentum above its trigger and zero lines.
To sum up, EUR/USD has been in a neutral-to-bullish bias in the short- to medium-term timeframes as it is attempting to remain above the downtrend line, but the sideways channel still holds.
Author

Melina joined XM in December 2017 as an Investment Analyst in the Research department. She can clearly communicate market action, particularly technical and chart pattern setups.


