EUR/USD nosedives, gold and oil outperform

Key Highlights
- EUR/USD extended decline below the 1.1120 support zone.
- Gold is eyeing upside break to $2,000, and oil price broke the $125.00 resistance.
EUR/USD Technical Analysis
Looking at the 4-hours chart, the pair settled below the 1.110 level, the 100 simple moving average (red, 4-hours), and the 200 simple moving average (green, 4-hours).
There was a clear move below the 1.1050 support zone. It even spiked below the 1.1000 level and is showing a few bearish signs. If there is a recovery wave, the pair could face resistance near the 1.100 level.
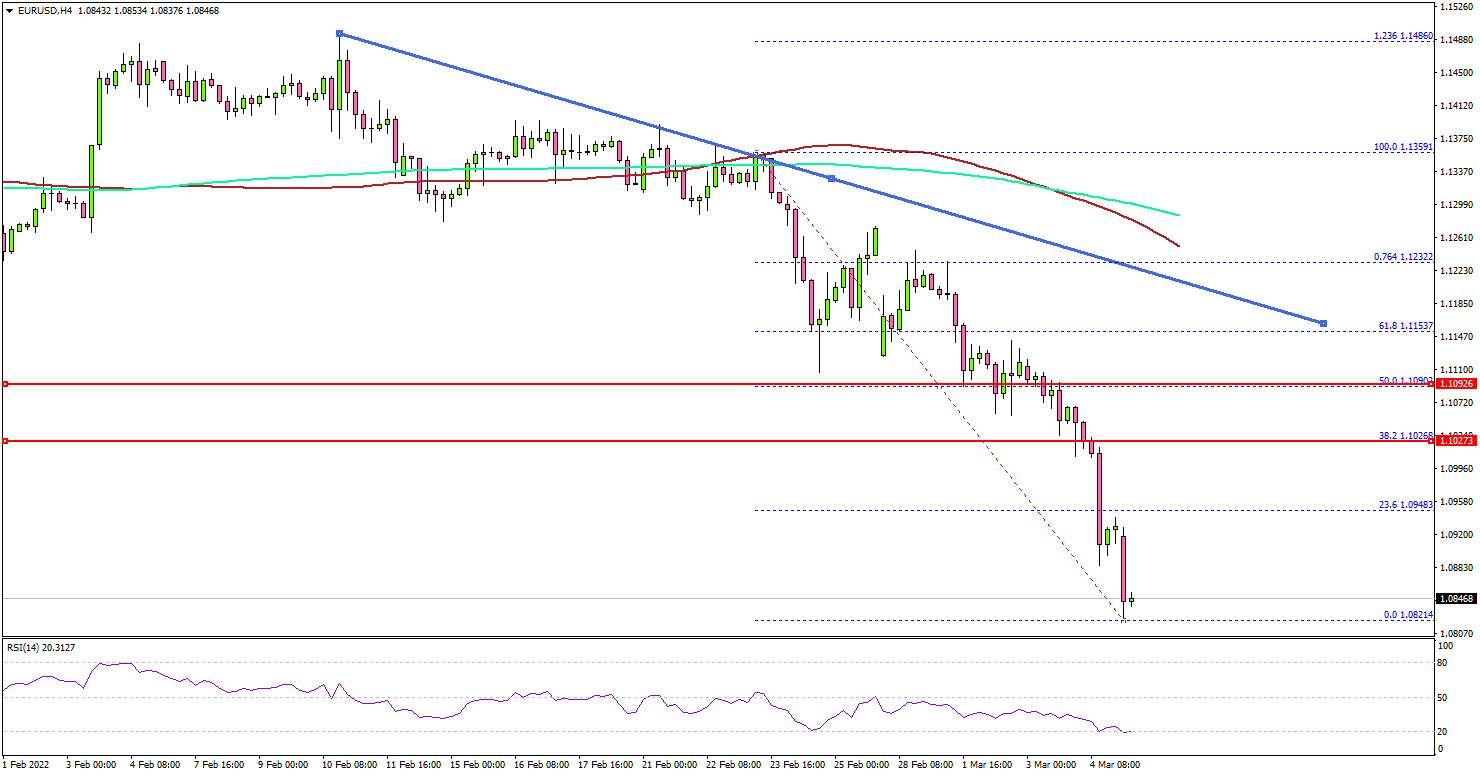
The next major resistance is near the 1.1060 level. To start a decent recovery wave, EUR/USD must clear the 1.1060 and 1.1080 resistance levels.
If not, the pair might continue to move down below the 1.0880 support zone. The next key support is near 1.0820 level, below which there is a risk of a move towards the 1.0750 level.
Author

Aayush Jindal
TitanFX
I have spent over six years as a financial markets contributor and observer, and possess strong technical analytical skills. I am a software engineer by profession, loves blogging and observing financial markets.


