EUR/USD: looking for a breakout at the horizontal and trendline resistance to go long

EUR/USD is about to make a significant breakout towards the North on the daily chart. Today’s intraday price action has been bullish, and a level of resistance which has been held for a long time has been breached on the minor time frames. If the price continues to be bullish and makes a breakout on the H4 chart as well, then the pair may remain bullish on the daily chart for a few days.
Let us have a look at the EUR/USD daily chart.
Chart 1 EUR/USD Daily Chart
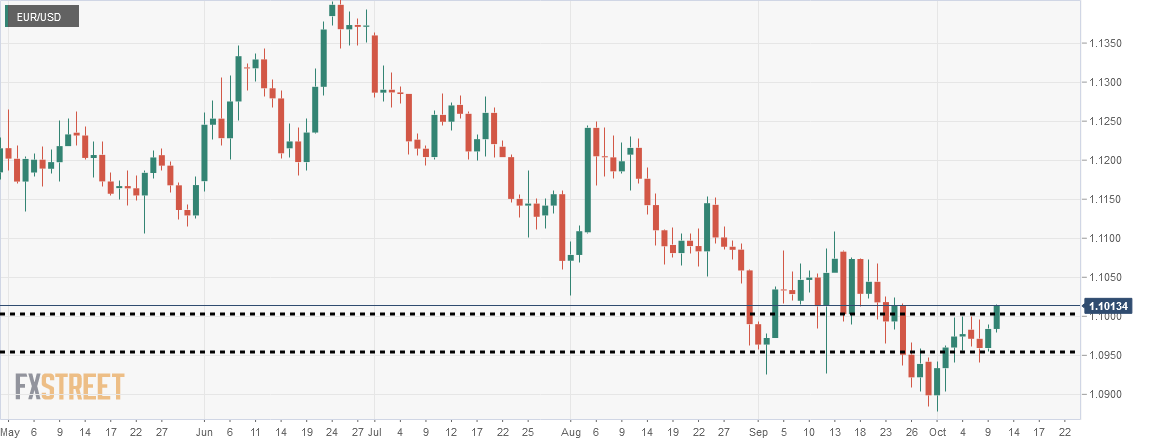
The price kept heading towards the South after making pullbacks. The level of 1.0900 has come out as a level of support from where the price has started heading towards North. Traders may think it is a pullback as well, so the price may get bearish on a daily reversal candle. It remains a possibility. However, the price after having consolidation and producing a bullish engulfing daily candle at the level of 1.0950, it has made a breakout at the level of 1.1000 on minor intraday charts. An H4 breakout at this level may attract more buyers to go long on the pair.
Here is another equation that may make the buyers more interested in buying the pair.
Chart 2 EUR/USD Daily Chart
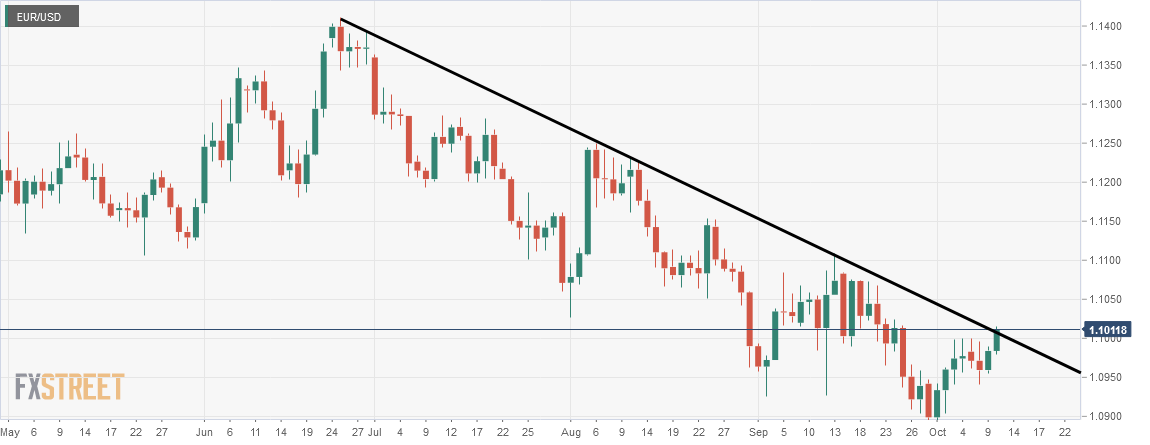
The price was down-trending by obeying a trendline. The chart above shows that the price had several rejections, and it is now right at the resistance of the trendline. The way it has been going, today’s daily candle may end up breaching the trendline’s resistance. Horizontal resistance and trendline resistance breakout at one go shall make the pair very bullish on the daily chart.
Let us observe the H4 EUR/USD chart
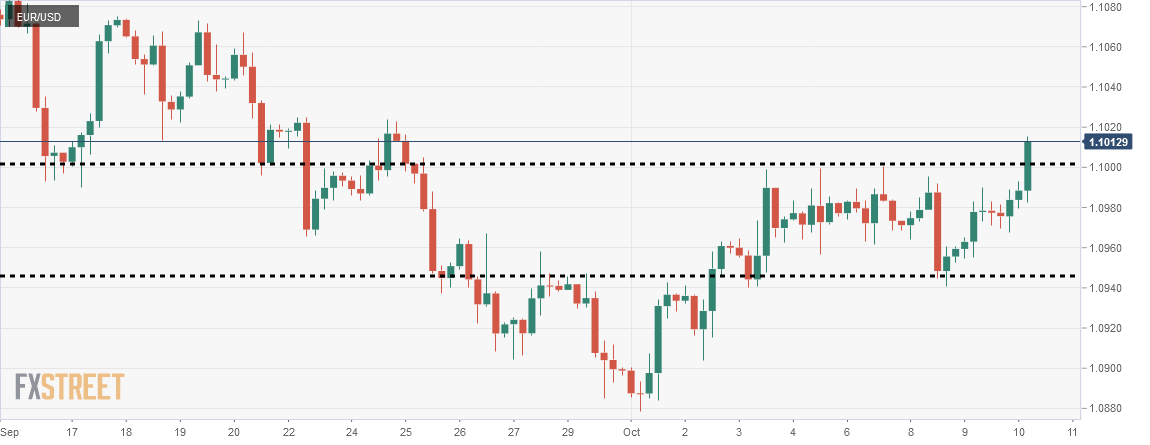
If we flip over from the daily chart to the H4 chart, both the support and resistance levels are to be adjusted a little. The H4 chart shows that the price has produced a Double Bottom at the level of 1.0945 and breached the neckline as well. It is not an H4 breakout yet, though. However, the price keeps pushing towards the North, which may end up making an H4 breakout. As mentioned earlier, an H4 breakout at the neckline of a Double Bottom shall add more fuel with its bullish move.
The H4 chart looks very good for the buyers, and the daily chart suggests that the traders should wait for the price to make a daily breakout at the horizontal as well as the trendline resistance breakout to go long on EURUSD.
Author

EagleFX Team
EagleFX
EagleFX Team is an international group of market analysts with skills in fundamental and technical analysis, applying several methods to assess the state and likelihood of price movements on Forex, Commodities, Indices, Metals and


