EUR/USD has Quietly Gone Bid this Week
The last few days have been the most volatile since Q4 2018 for stocks. Many world indices have given up 2020 gains (some from all-time highs) and are currently trading lower for the year. With stocks moving lower, one currency pair that has been quietly moving higher is the EUR/USD.
In a time long ago before negative rates, US stocks and EUR/USD moved together. However, once the ECB lowered rates into negative territory, the Euro became a funding currency. This is known as a “Carry Trade”. People borrow Euros at negative rates and buy riskier assets (this has been done with Yen for years, which is why USD/JPY and the S&P 500 often move together). However, now that stock markets have come off so much over recent days, people who are selling stocks (the riskier asset) need to buy back Euros (the funding currency). The is know as “Unwinding of Carry Trade”. Notice on the chart below that since the beginning of February, as stocks have been grinding higher, EUR/USD was moving lower. On February 20th (green vertical line) the correlation coefficient was -.90. For reference, a correlation coefficient of -1.00 is a perfectly negative correlation, meaning the as stocks move up (or down), EUR/USD moves down (or up) in lockstep. (Although the correlation coefficient has been moving higher the last few days, it is still negative. The fact that it is increasing just means that stocks have been moving lower at a faster pace than EUR/USD has been moving higher.)
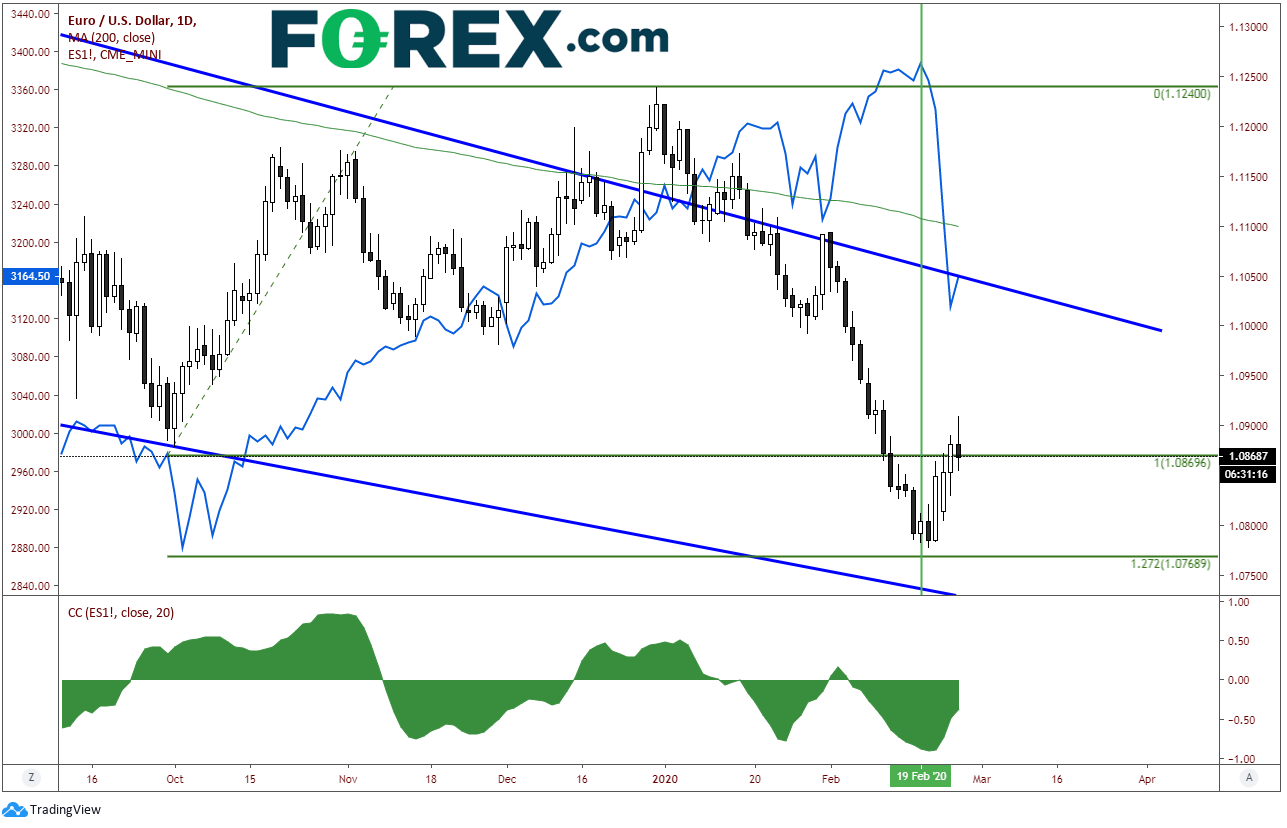
Source: Tradingview, CME, FOREX.com
As a reminder, EUR/USD has been trading in a falling wedge since mid-2018. After a failed attempt to break higher out of the wedge this year, price formed a head and shoulders pattern, and broke back into the wedge, reaching the Head and Shoulders target. As we have often written about, if price fails to break out of one side of a pattern, it often tests the other side. This is precisely what happened here as EUR/USD traded down near the bottom trendline of the falling wedge and the 127.2% Fibonacci extension from the October 1st lows to the December 31st highs near 1.0780. The pair bounced over the last few days to previous support (now acting as resistance) near 1.0880 as stocks sold off. This also allowed for the oversold RSI to move back into neutral territory.
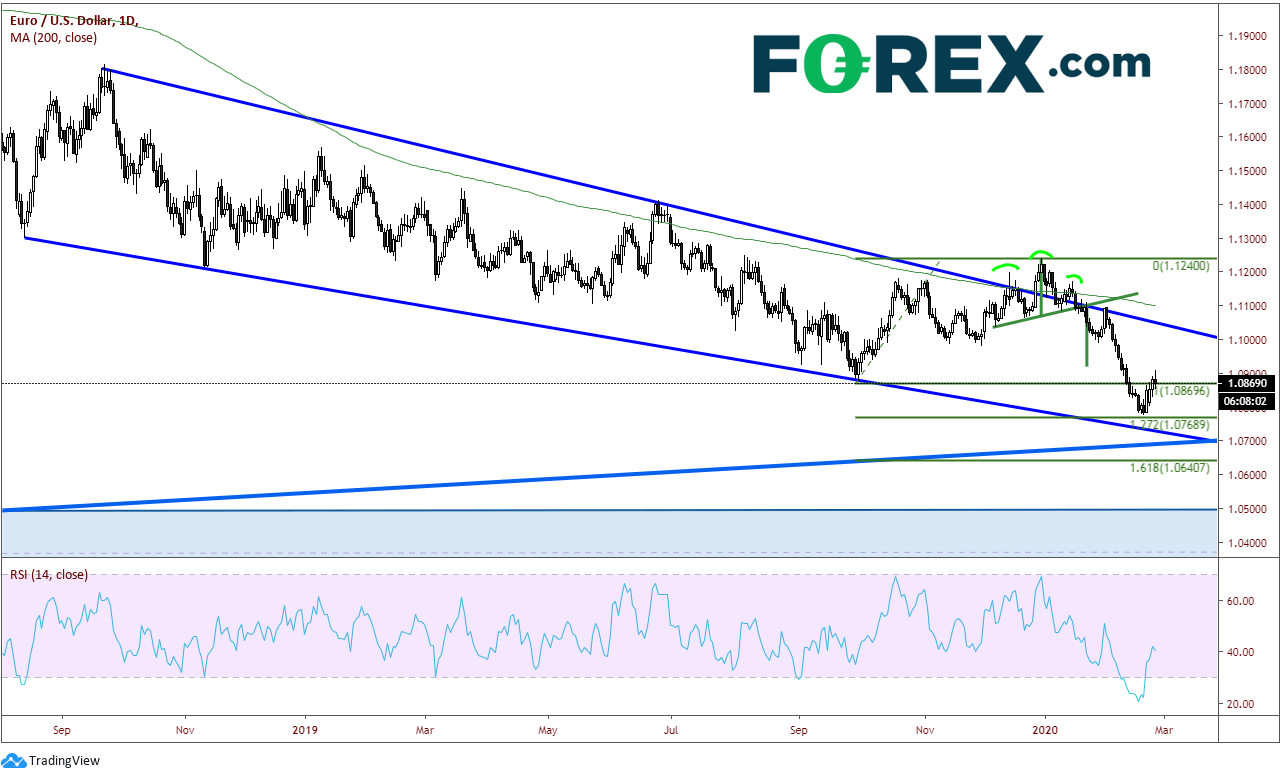
Source: Tradingview, FOREX.com
On a 240-minute timeframe, EUR/USD has retraced from the January 31st highs to the February 20th lows to the 38.2% retracement level near 1.0900, forming a flag pattern. The target for the pattern, if it breaks lower from here is near 1.0600. However, price must pass through support near 1.0780, and two channel trendlines (on the daily) and the 161.8% Fibonacci extension from the Sept-Dec mentioned timeframe (on the daily chart) to reach that level. Resistance above at recent highs near 1.0900. Above there is horizontal resistance and the 50% retracement from the Jan 31ST -Feb 20th timeframe near 1.0940/50, and then horizontal resistance near 1.1000.
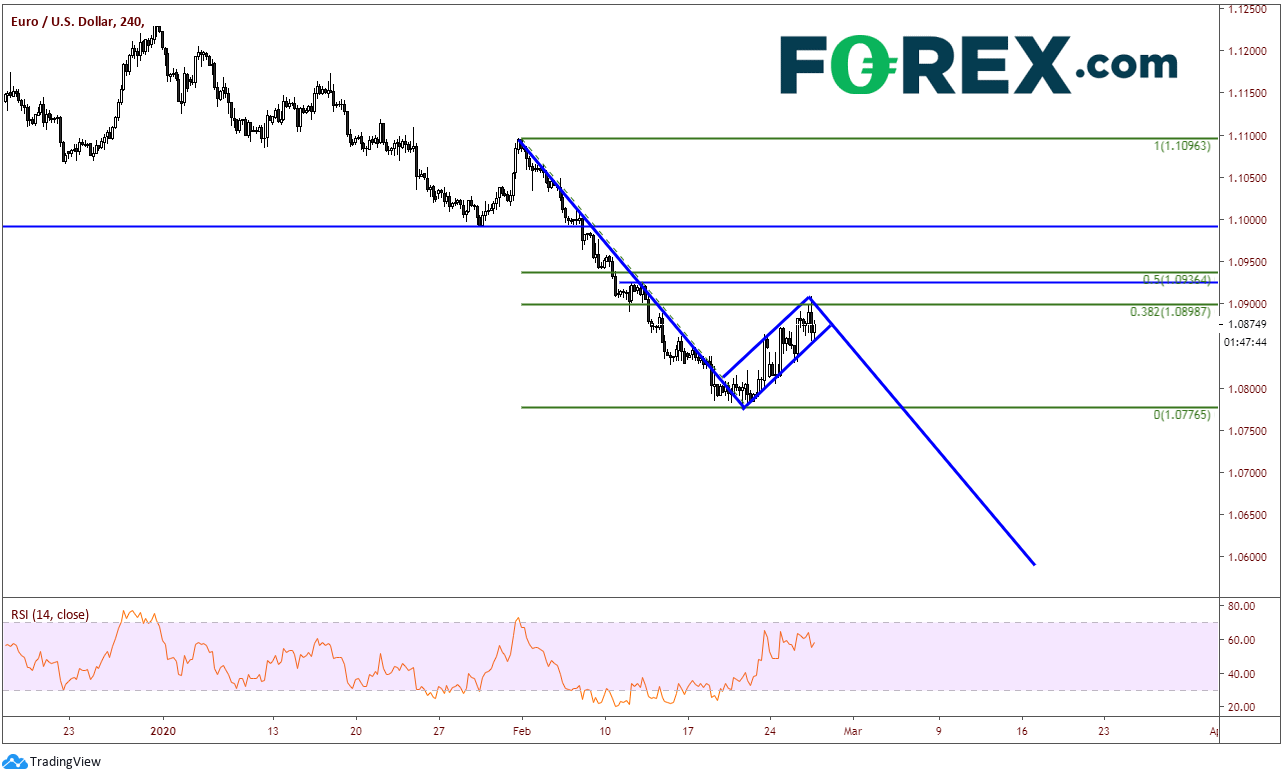
Source: Tradingview, FOREX.com
Today’s candle on a daily chart is currently a doji, or candle of indecision. As long as the ECB keeps rates negative, the Euro will be used as a funding currency. In the near term, in absence of large economic data discrepancies, the value of EUR/USD is likely to be driven by stocks. And as we have been over the past few days, the value of stocks has been driven by the coronavirus.
Author

Joe Perry CMT
Forex Analytix
Joe Perry is currently Global Head of Business Development at Forex Analytix. From 2000-2018, Joe traded at SAC Capital Advisors and then Point72 Asset Management. He has traded foreign exchange and commodity futures for the last 20 years.


