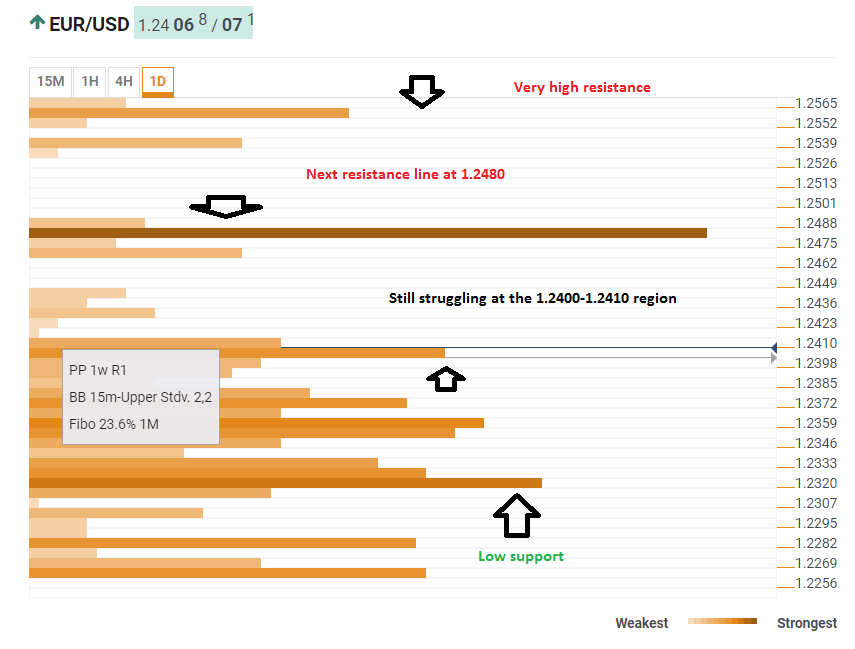
After the EUR/USD made a move above $1.2400, the Technical Confluences Indicator shows the next areas of resistance on the way up. There are very few areas of congested caps between the current trading levels and $1.2480. Up there, we have a convergence of the one-month high, the Pivot Point one-day R3, PP one-month R1, and the PP one-week R2. All are strong lines.
Beyond this line, $1.2555 is the apparent barrier as the 52-week high and the highest level in over three years.
However, the pair is still struggling to confirm the move above $1.2400 and for good reasons. The $1.2400-1.2410 area the pair is struggling with is packed with significant technical lines: the SMA-5-15m, the Pivot Point one-day R1, the Bolinger Band 15m-Upper (Stdv. 2.2), the Pivot Point one-week R1, the Fibonacci 23.6% one-month, and more.
A failure to hold onto these gains may send the pair down to the $1.2360 region were we see the confluence of the SMA50-1h, the SMA100-1h, the Fibo 38.2% one-month, the SMA10-4h, the BB 1h-Middle, the Fibo 61.8% one-day, and the SMA-5 one-day.
Here is how it looks on the tool:
Confluence Detector
The Confluence Detector finds exciting opportunities using Technical Confluences. The TC is a tool to locate and point out those price levels where there is a congestion of indicators, moving averages, Fibonacci levels, Pivot Points, etc. Knowing where these congestion points are located is very useful for the trader, and can be used as a basis for different strategies.
This tool assigns a certain amount of “weight” to each indicator, and this “weight” can influence adjacents price levels. This means that one price level without any indicator or moving average but under the influence of two “strongly weighted” levels accumulate more resistance than their neighbors. In these cases, the tool signals resistance in apparently empty areas.
Information on these pages contains forward-looking statements that involve risks and uncertainties. Markets and instruments profiled on this page are for informational purposes only and should not in any way come across as a recommendation to buy or sell in these assets. You should do your own thorough research before making any investment decisions. FXStreet does not in any way guarantee that this information is free from mistakes, errors, or material misstatements. It also does not guarantee that this information is of a timely nature. Investing in Open Markets involves a great deal of risk, including the loss of all or a portion of your investment, as well as emotional distress. All risks, losses and costs associated with investing, including total loss of principal, are your responsibility. The views and opinions expressed in this article are those of the authors and do not necessarily reflect the official policy or position of FXStreet nor its advertisers. The author will not be held responsible for information that is found at the end of links posted on this page.
If not otherwise explicitly mentioned in the body of the article, at the time of writing, the author has no position in any stock mentioned in this article and no business relationship with any company mentioned. The author has not received compensation for writing this article, other than from FXStreet.
FXStreet and the author do not provide personalized recommendations. The author makes no representations as to the accuracy, completeness, or suitability of this information. FXStreet and the author will not be liable for any errors, omissions or any losses, injuries or damages arising from this information and its display or use. Errors and omissions excepted.
The author and FXStreet are not registered investment advisors and nothing in this article is intended to be investment advice.
Recommended Content
Editors’ Picks

EUR/USD bounces off lows, approaches 1.1550
EUR/USD continues to recover ground lost and now extends the rebound to the 1.1550 zone on Friday. Meanwhile, the US Dollar maintain its bullish bias intact in response to a significant flight to safety amid increasing geopolitical concerns, while positive consumer sentiment data also contribute to the daily uptick.

Gold keeps the trade above $3,400 on safe-haven demand
Gold prices maintain its upward trajectory on Friday, reaching its peak level since late April above the $3,400 mark per troy ounce. Furthermore, the precious metal draws increased safe-haven interest amid escalating tensions in the Middle East, triggered by Israel's military action against Iran.

GBP/USD trims losses, retargets 1.3600
After an earlier dip toward the 1.3520 area, GBP/USD has regained some composure, trading within sight of the key 1.3600 barrier as the week draws to a close. The pair remains under pressure on Friday, weighed down by renewed US Dollar strength amid rising risk aversion and a stronger-than-expected consumer confidence report.

Crypto Today: Bitcoin, Ethereum, XRP clamber for support amid escalating volatility on Israel-Iran tensions
The cryptocurrency market has been hit by a sudden wave of extreme volatility, triggering widespread declines as global markets react to tensions between Israel and Iran. Bitcoin is hovering at around $104,668 at the time of writing on Friday, following a reflex recovery from support tested at $102,513.

Week ahead – Markets brace for central bank barrage amid heightened uncertainty
Fed officials to stand pat as they await further clarity. A dovish BoJ could push rate hike expectations into 2026. Deflation fuels speculation about negative SNB rates. BoE may sound more dovish after disappointing UK data.