The EUR/USD made a sharp turnaround and trades at higher ground. What are the next levels to watch?. 

The Technical Confluences Indicator shows that the pair faces a clear congestion of resistance levels at 1.1666. This is the convergence of the Simple Moving Average 50-4h, the SMA 200-1h, the Fibonacci 38.2% one-week, the Pivot Point one-day Resistance 3, and the Bolinger Band one-day Middle. 

Further above, a confluence of potent caps awaits at 1.1738 where the Fibonacci 61.8% one-week, the Fibonacci 38.2% one-month, and the Simple Moving Average 200-4h await. 

On the downside, 1.1575 is the congestion of the Simple Moving Average 100-15m, the SMA 50-1h, the SMA 200-15m, the SMA 5-1h, the SMA 10-4h and more. 

Even lower, the 1.1539 level is another support line featuring the Bolinger Band one-hour Lower, the one-day High, and the Pivot Point one-day Support 1.

Here is how it looks on the tool:
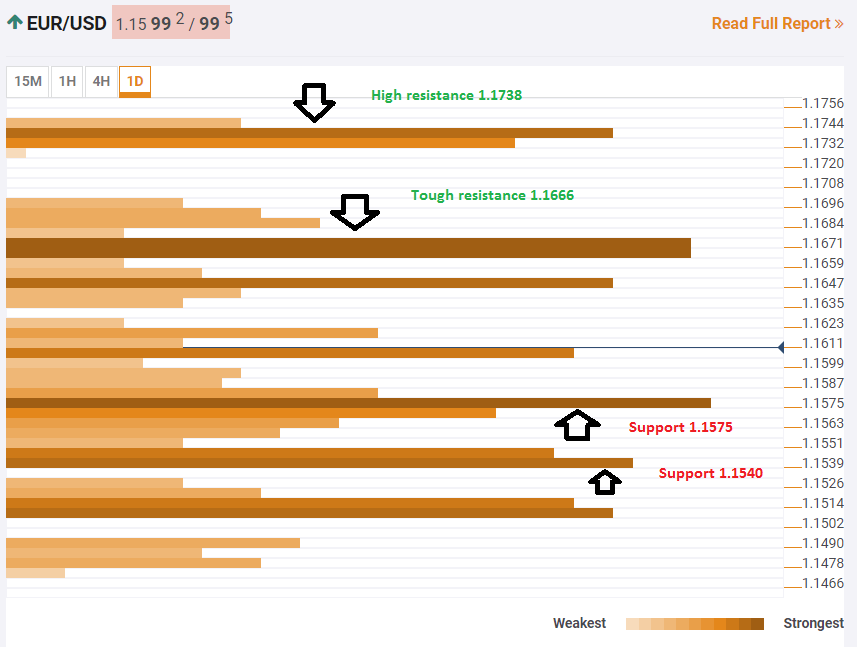
Confluence Detector

The Confluence Detector finds exciting opportunities using Technical Confluences. The TC is a tool to locate and point out those price levels where there is a congestion of indicators, moving averages, Fibonacci levels, Pivot Points, etc. Knowing where these congestion points are located is very useful for the trader, and can be used as a basis for different strategies.

This tool assigns a certain amount of “weight” to each indicator, and this “weight” can influence adjacents price levels. These weightings mean that one price level without any indicator or moving average but under the influence of two “strongly weighted” levels accumulate more resistance than their neighbors. In these cases, the tool signals resistance in apparently empty areas.

Learn more about Technical Confluence

Information on these pages contains forward-looking statements that involve risks and uncertainties. Markets and instruments profiled on this page are for informational purposes only and should not in any way come across as a recommendation to buy or sell in these assets. You should do your own thorough research before making any investment decisions. FXStreet does not in any way guarantee that this information is free from mistakes, errors, or material misstatements. It also does not guarantee that this information is of a timely nature. Investing in Open Markets involves a great deal of risk, including the loss of all or a portion of your investment, as well as emotional distress. All risks, losses and costs associated with investing, including total loss of principal, are your responsibility. The views and opinions expressed in this article are those of the authors and do not necessarily reflect the official policy or position of FXStreet nor its advertisers. The author will not be held responsible for information that is found at the end of links posted on this page.

If not otherwise explicitly mentioned in the body of the article, at the time of writing, the author has no position in any stock mentioned in this article and no business relationship with any company mentioned. The author has not received compensation for writing this article, other than from FXStreet.

FXStreet and the author do not provide personalized recommendations. The author makes no representations as to the accuracy, completeness, or suitability of this information. FXStreet and the author will not be liable for any errors, omissions or any losses, injuries or damages arising from this information and its display or use. Errors and omissions excepted.

The author and FXStreet are not registered investment advisors and nothing in this article is intended to be investment advice.

Recommended Content


Recommended Content

Editors’ Picks

AUD/USD hovers around 0.6500 amid light trading, ahead of US GDP

AUD/USD hovers around 0.6500 amid light trading, ahead of US GDP

AUD/USD is trading close to 0.6500 in Asian trading on Thursday, lacking a clear directional impetus amid an Anzac Day holiday in Australia. Meanwhile, traders stay cautious due ti risk-aversion and ahead of the key US Q1 GDP release. 

AUD/USD News

USD/JPY finds its highest bids since 1990, near 155.50

USD/JPY finds its highest bids since 1990, near 155.50

USD/JPY keeps breaking into its highest chart territory since June of 1990 early Thursday, testing 155.50 for the first time in 34 years as the Japanese Yen remains vulnerable, despite looming Japanese intervention risks. Focus shifts to Thursday's US GDP report and the BoJ decision on Friday. 

USD/JPY News

Gold price treads water near $2,320, awaits US GDP data

Gold price treads water near $2,320, awaits US GDP data

Gold price recovers losses but keeps its range near $2,320 early Thursday. Renewed weakness in the US Dollar and the US Treasury yields allow Gold buyers to breathe a sigh of relief. Gold price stays vulnerable amid Middle East de-escalation, awaiting US Q1 GDP data. 

Gold News

Injective price weakness persists despite over 5.9 million INJ tokens burned

Injective price weakness persists despite over 5.9 million INJ tokens burned

Injective price is trading with a bearish bias, stuck in the lower section of the market range. The bearish outlook abounds despite the network's deflationary efforts to pump the price. Coupled with broader market gloom, INJ token’s doomed days may not be over yet.

Read more

Meta Platforms Earnings: META sinks 10% on lower Q2 revenue guidance Premium

Meta Platforms Earnings: META sinks 10% on lower Q2 revenue guidance

This must be "opposites" week. While Doppelganger Tesla rode horrible misses on Tuesday to a double-digit rally, Meta Platforms produced impressive beats above Wall Street consensus after the close on Wednesday, only to watch the share price collapse by nearly 10%.

Read more

Majors

Cryptocurrencies

Signatures