EUR/USD, GBP/USD Build Key Sideways Correction and Chart Patterns

EUR/USD
4 hour
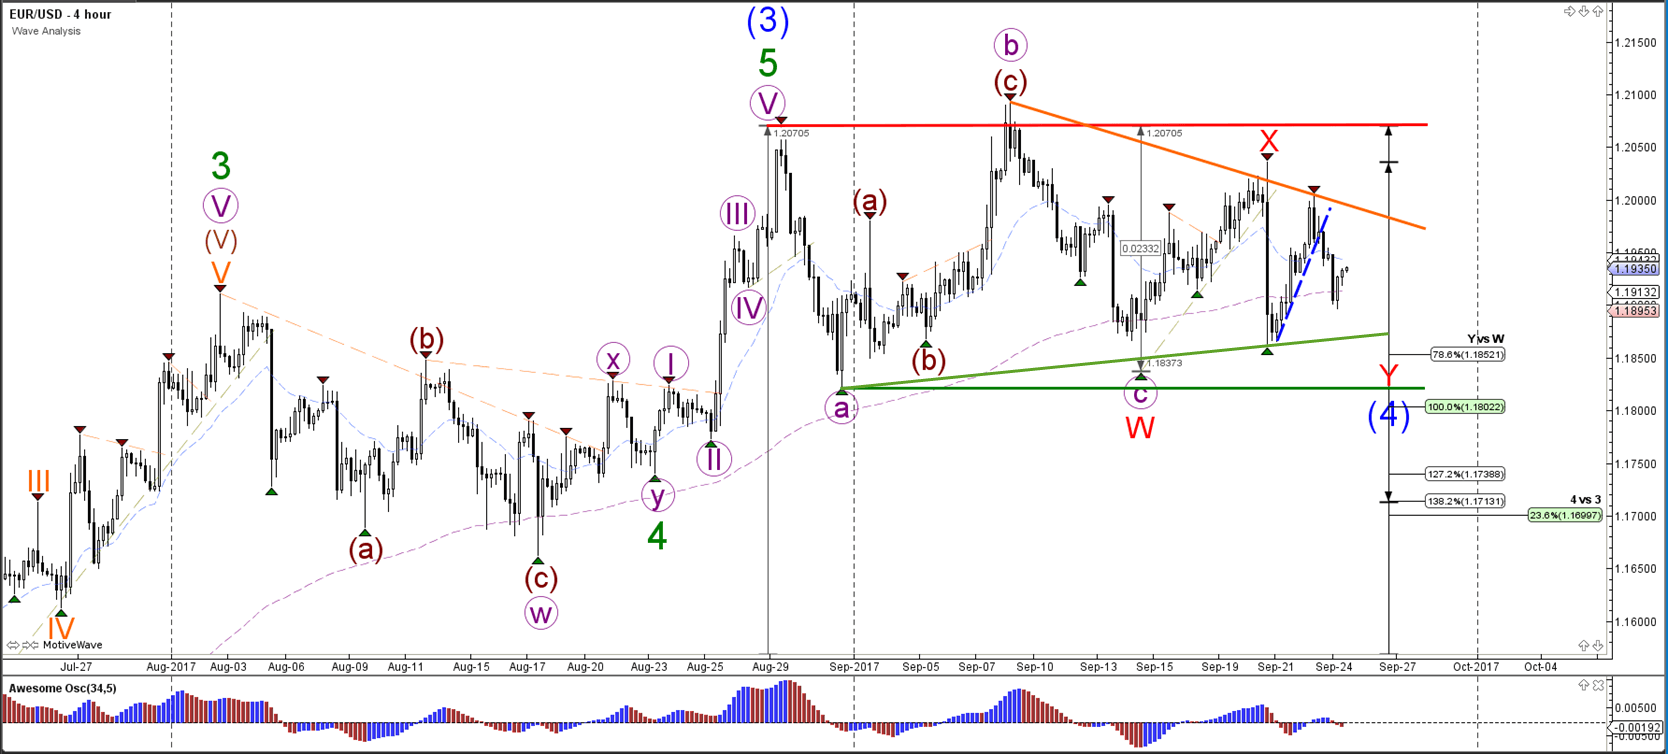
The EUR/USD is moving sideways as price stays in between support (green) and resistance (red) trend lines. The overall trend however is up and a bearish break could stop at the Fibonacci support levels of wave 4 (blue). A bullish breakout could indicate that the WXY (red) correction is finished.
1 hour
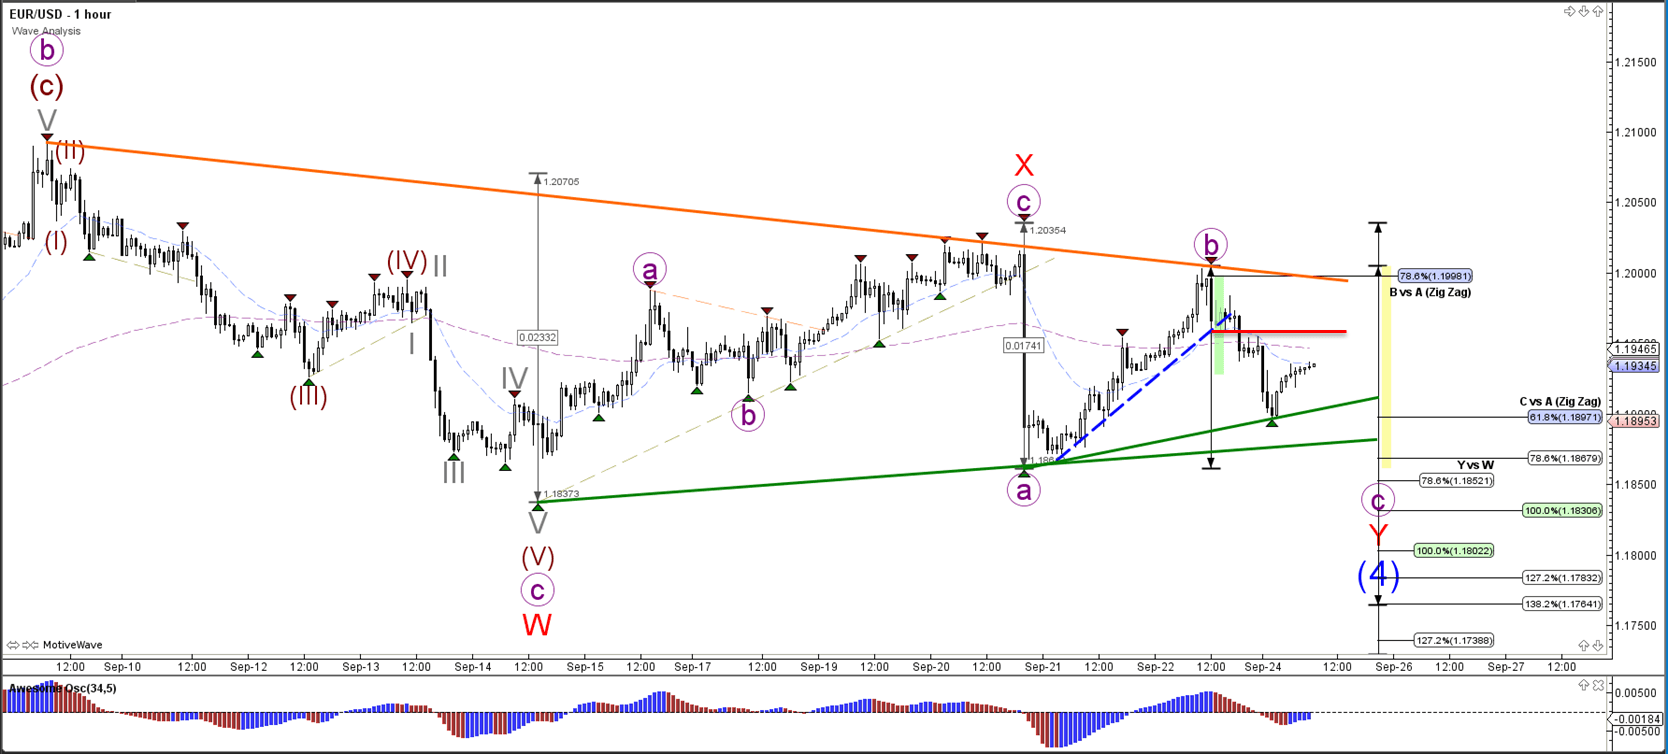
The EUR/USD is in a triangle chart pattern which is indicated by the trend lines. Price is in a wave C (purple) of wave Y (red) unless price manages to break above resistance (red). In that case, the wave C is most likely completed at the most recent bottom.
GBP/USD
4 hour
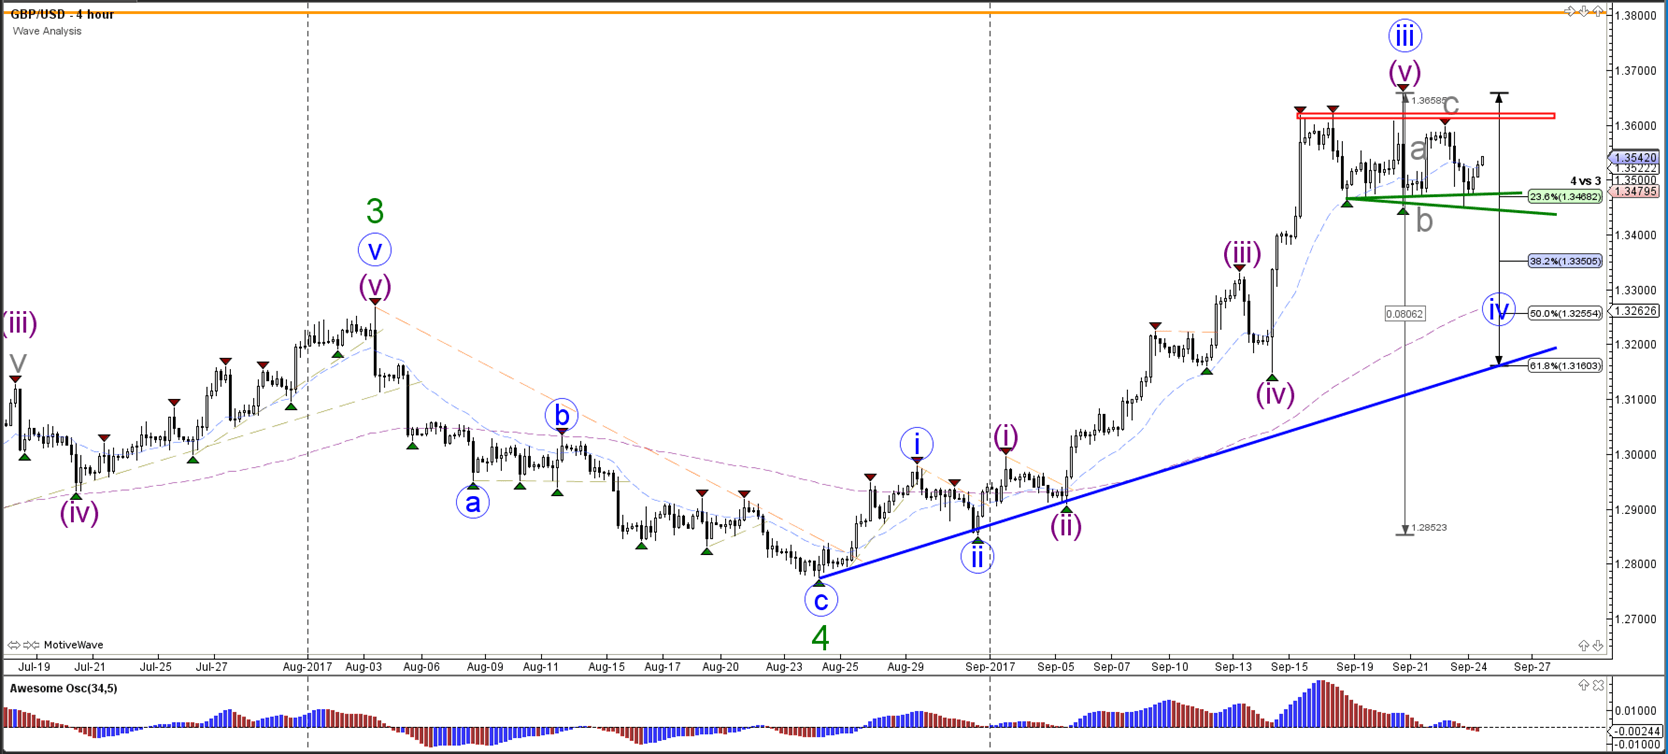
The GBP/USD is also in a sideways range (red/green lines) within a larger uptrend.A break below support could see price challenge the 38.2% Fibonacci level of wave 4 vs 3. A break above resistance could see price continue with the trend.
1 hour
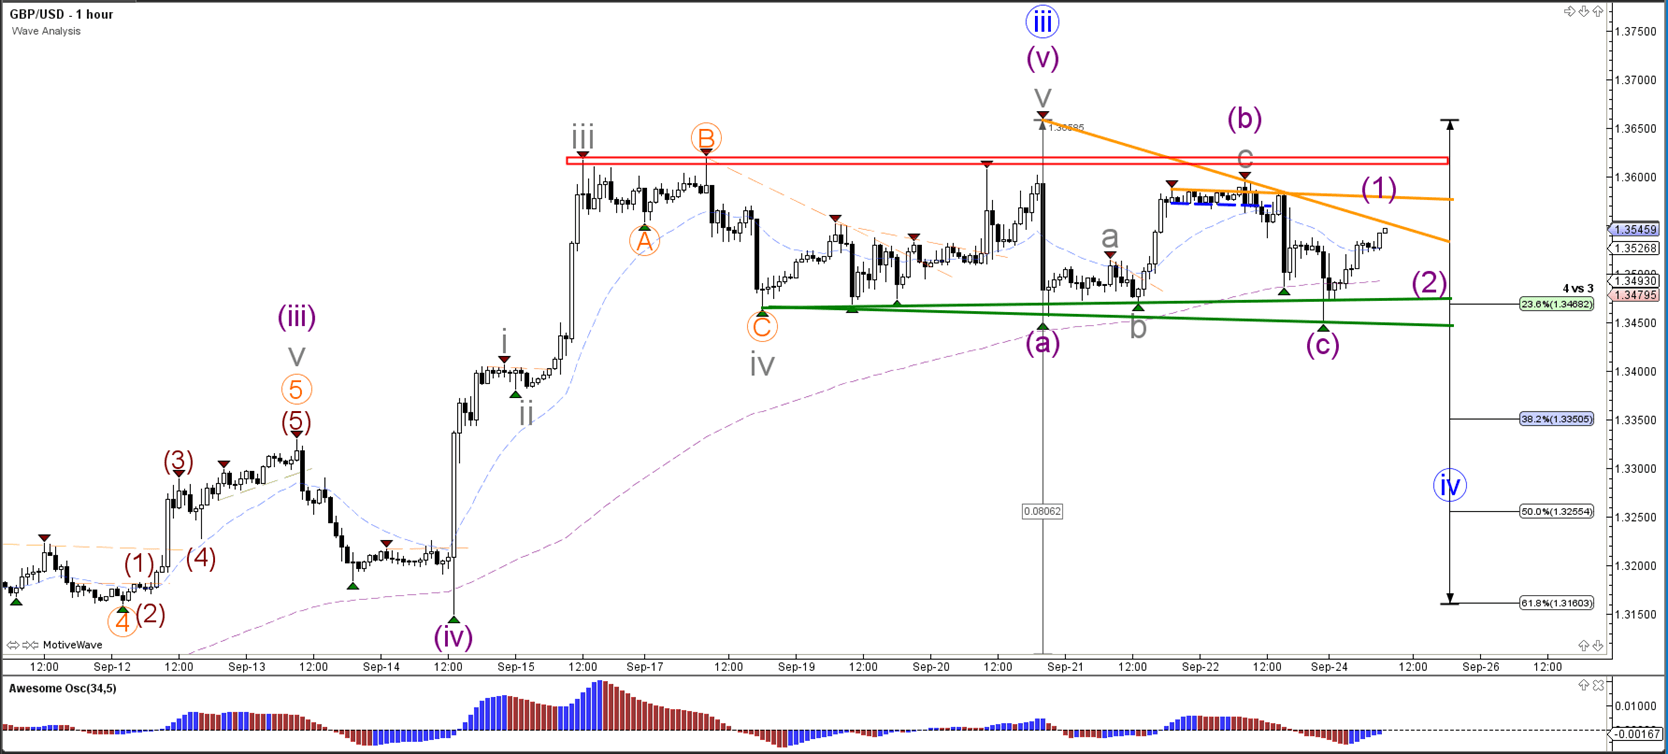
The GBP/USD needs to breakout below support (green) or above resistance (red/orange) otherwise the sideways range remains valid.
USD/JPY
4 hour
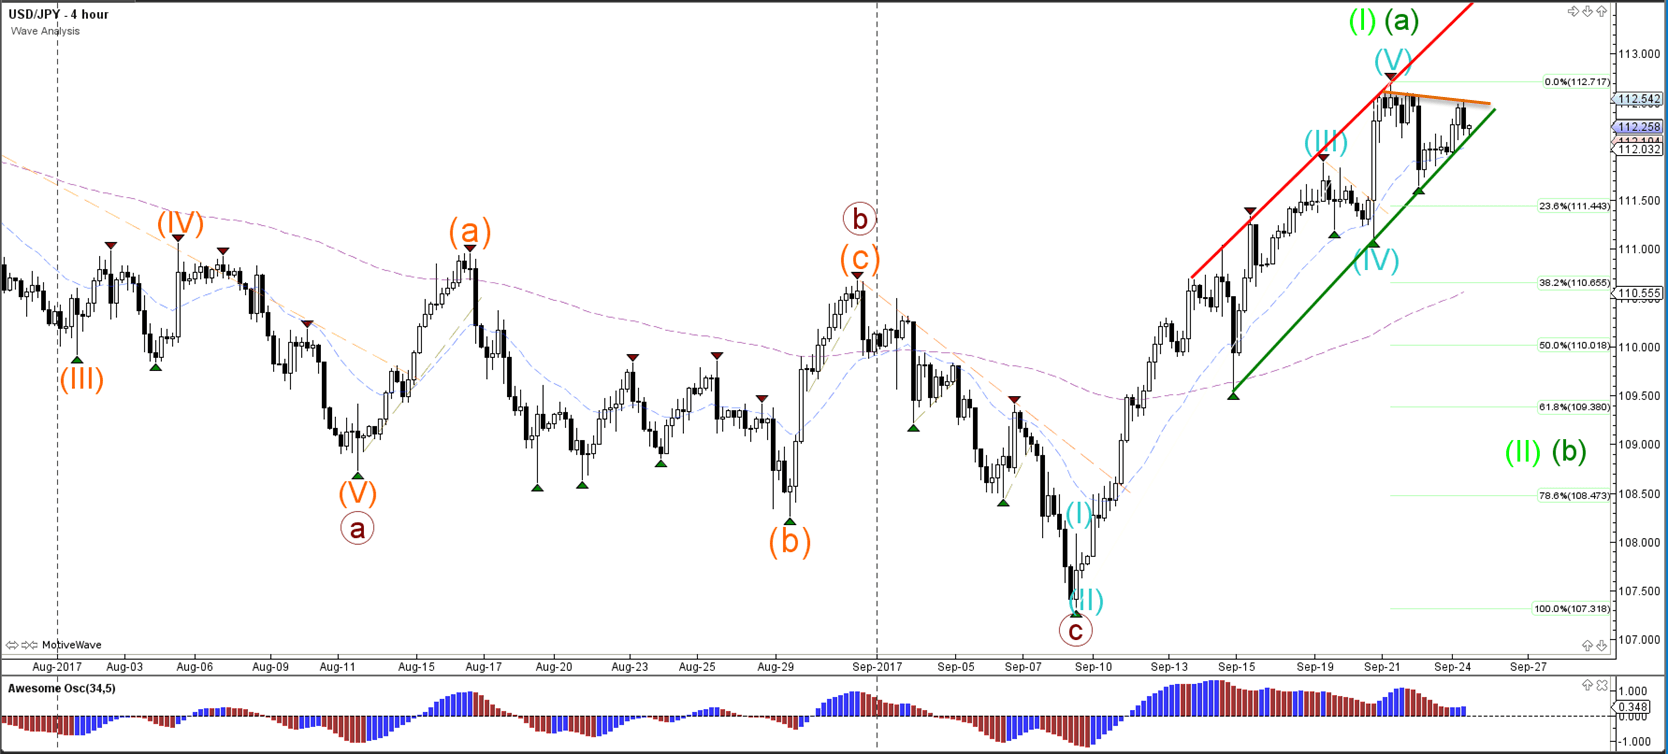
The USD/JPY is testing a support trend line (green) of the uptrend channel.
1 hour
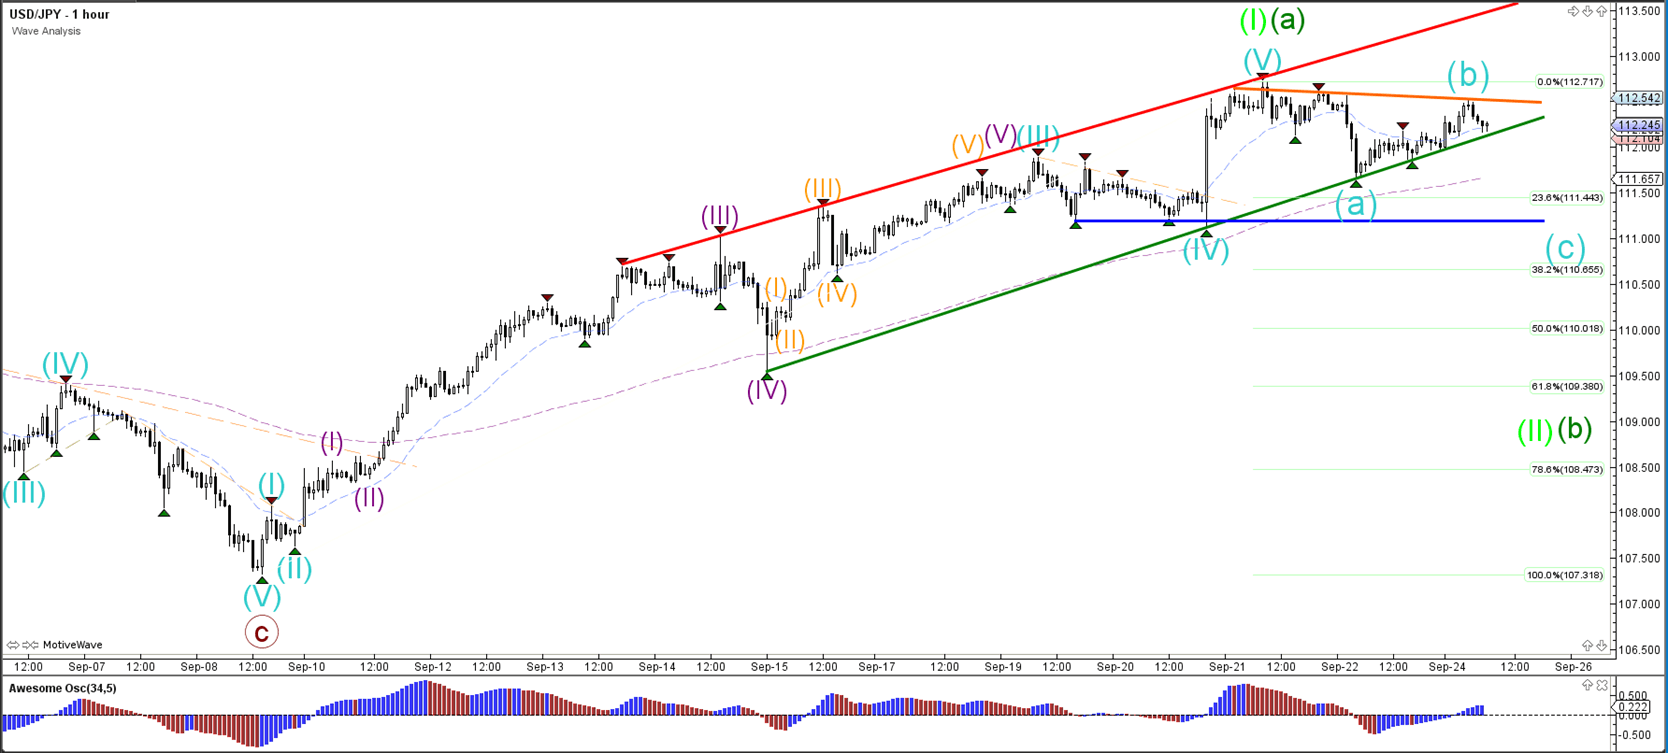
The USD/JPY needs to break above resistance (orange) before an uptrend continuation is likely. A break below support (blue) could confirm an ABC (blue) correction.
Author

Chris Svorcik
Elite CurrenSea
Experience Chris Svorcik has co-founded Elite CurrenSea in 2014 together with Nenad Kerkez, aka Tarantula FX. Chris is a technical analyst, wave analyst, trader, writer, educator, webinar speaker, and seminar speaker of the financial markets.


