EUR/USD found buyers after three waves pull back

In this technical article we’re going to take a look at the Elliott Wave charts charts of EURUSD forex pair published in members area of the website. As our members know, recently EURUSD made a 3-wave pullback that completed right at the equal legs level. In the following sections, we will analyze the charts and explain the Elliott Wave forecast.
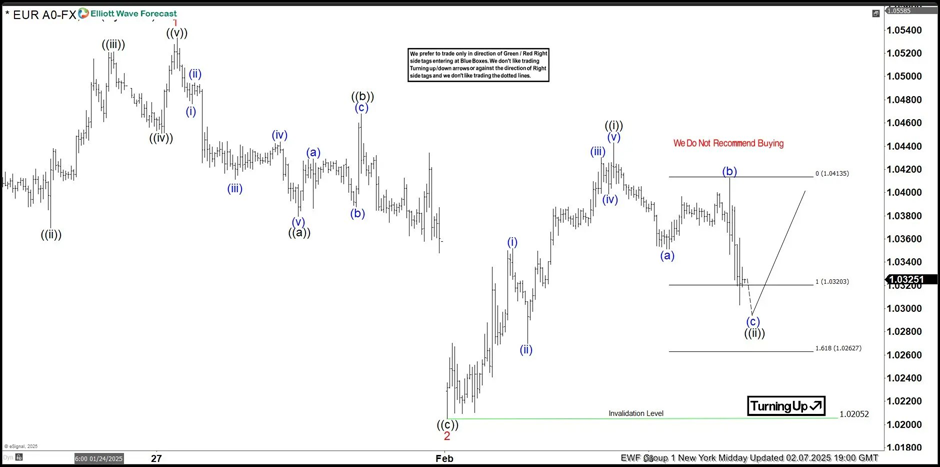
EUR/USD Elliott Wave one-hour chart 02.07.2025
EURUSD ended cycle from the 1.0205 low as 5 waves structure- wave ((i)) black. The pair is currently giving us pull back against the 1.0205 low. Equal legs area is already reached at 1.0320-1.0262 area. We are aware that pull back can complete any moment. Although we expect to see rally from the marked area, we don’t recommend forcing the trades at this stage.
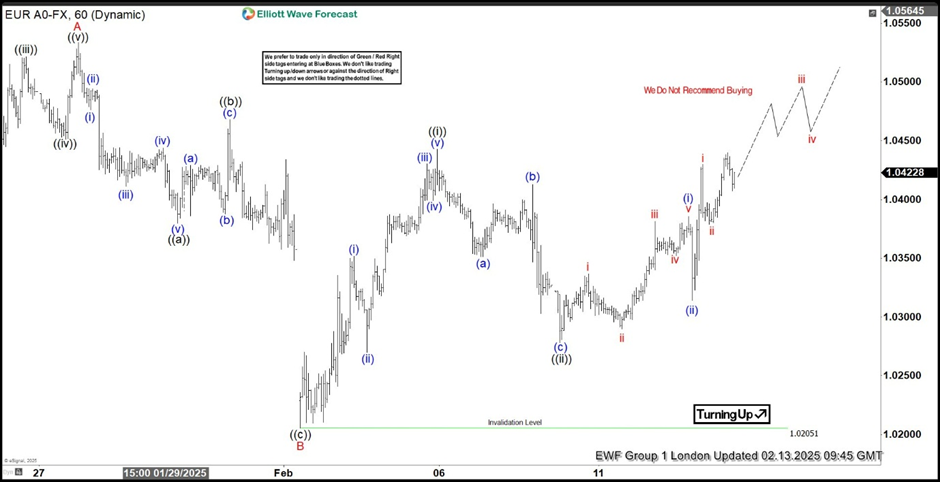
EUR/USD Elliott Wave one-hour chart 02.07.2025
The pair found buyers in the 1.0320-1.0262 area as expected and completed the correction at the 1.0286 low. We’d like to see a break of the ((i)) black peak to confirm further upward movement toward the 1.05129-1.05671 area.
Author

Elliott Wave Forecast Team
ElliottWave-Forecast.com


