EUR/USD Forecast: Triangle breakout awaits Trump
- EUR/USD has been trading in a tight range ahead of the all-important Trump-Xi summit.
- Euro-zone inflation figures and end-of-quarter flows are set to move markets.
- Friday's four-hour chart shows a narrowing wedge which implies sharp moves are due.

Will Presidents Donald Trump and Xi Jinping announce a trade truce? That is the question on traders' minds – but the answer will probably come only after markets close for the weekend.
EUR/USD and other financial assets are trading in a narrow range ahead of the all-important summit between the leaders of the world's largest economies. Reports have suggested that both sides would agree to refrain from imposing new tariffs and resume trade talks. However, China has asked the US to lift punitive duties and sanctions against Huawei – the telecommunications giant that is suspected of working with the Chinese military – and the Trump administration is unkeen on granting this gesture.
Ahead of the summit, Trump has said that his encounter with Xi will be "productive at a minimum." On the other hand, he has left the door open to slapping new levies. Markets will be pleased with a trade truce and do not expect a full trade deal. In case of a successful meeting, the safe-haven USD may lose ground. Yet if talks end without an accord, the greenback may rise.
Ahead of the summit, preliminary euro-zone inflation consumer price index is forecast to remain at 1.2% year on year while core CPI is set to increase from 0.8% in May to 1% in June. The next decision of the European Central Bank hinges on the inflation outlook – and these data are watched closely. French CPI has come out at 0.2% month over month – above expectations – while German numbers are at 1.3% YoY, as expected.
The Federal Reserve's preferred gauge of inflation is due later today, and it is also expected to remain at low levels – opening the door to a rate cut. Mary Daly, President of the San Francisco branch of the Federal Reserve, has said that the Fed's July decision depends on the data and could range from leaving rates unchanged to slashing them by 50 basis points. A cut of 25bp is priced in.
See US PCE Price Index Preview: It’s not deflation you know
Today is the last day of the week, month, and quarter. Money managers will be rushing to adjust their portfolios, and the current tight ranges may be replaced with choppy price action – especially around 15:00 GMT – at the London close.
Overall, the focus remains on the summit with brief interruptions for data.
EUR/USD Technical Analysis
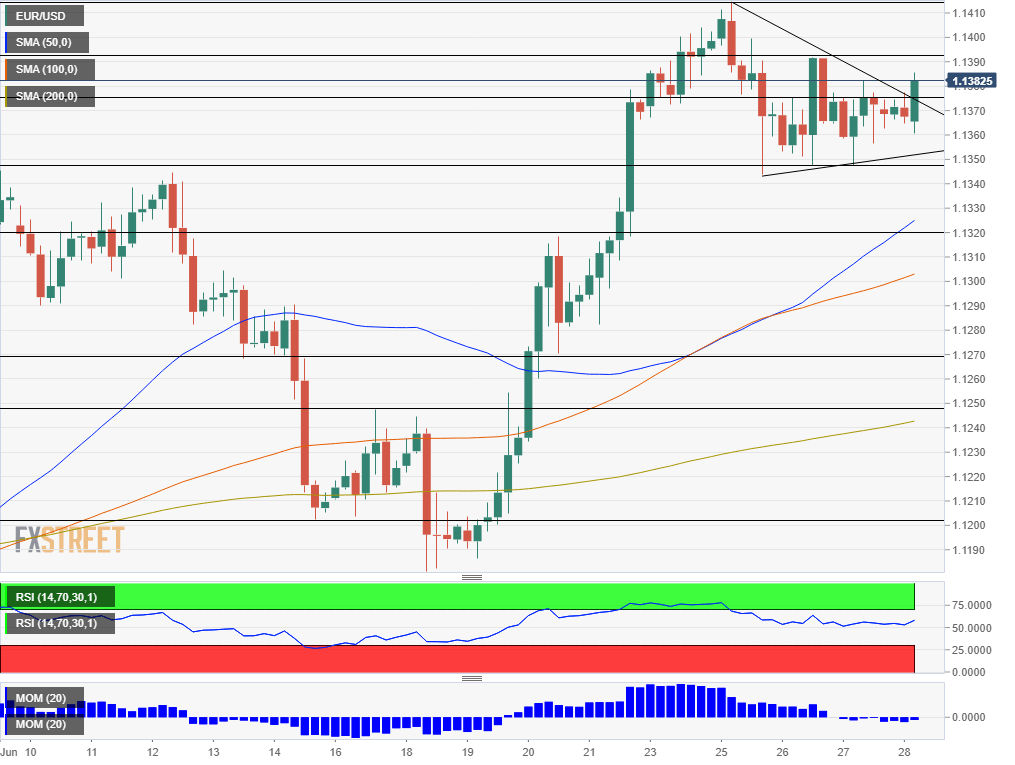
EUR/USD is trading in a narrow range and trying to break above the narrow wedge or triangle. Technical analysis textbooks suggest that trading in limited ranges results in a sharp move later on.
To which direction? Signals are mixed. Momentum on the four-hour chart is marginal to the downside while the Relative Strength Index is pointing higher.
Some resistance awaits at 1.1390 which capped EUR/USD earlier this week. It is followed by the weekly high of 1.1415. The next line to watch is 1.1445, which dates back to March, followed by 1.1520 – another peak from early in the year.
Some support awaits at 1.1375, which temporarily separated ranges early in the week. More importantly, 1.1350 provided support this week and capped the currency pair in mid-June. The next lines to watch are 1.1320 and 1.1270.
Author

Yohay Elam
FXStreet
Yohay is in Forex since 2008 when he founded Forex Crunch, a blog crafted in his free time that turned into a fully-fledged currency website later sold to Finixio.
















