EUR/USD Forecast: Technical breakout is yet to come
- EUR/USD struggles to find direction for third straight day.
- Rising US T-bond yields helped USD stay resilient against its rivals.
- Investors await Jobless Claims and Retail Sales data from US.

For the third straight day on Wednesday, the EUR/USD pair struggled to make a decisive move in either direction and ended up closing the day little changed near 1.1800.
Earlier in the day, the data from the euro area showed that Industrial Production expanded by 1.5% on a monthly basis in July. Although this reading beat analysts' estimate for an increase of 0.6%, the market reaction was largely muted.
On the other hand, the Federal Reserve Bank of New York reported that the Empire State Manufacturing Index improved sharply to 34.3 in September from 18.3 in August. Additionally, the Federal Reserve reported that Industrial Production rose by 0.4% in August, compared to the market consensus of 0.5%. Nevertheless, investors paid little to no attention to these data.
In the meantime, Wall Street's main indexes gained traction after opening flat, making it difficult for the greenback to find demand as a safe haven. At the time of press, the S&P 500 Index was up 0.78% on the day at 4,477. However, the 2% increase witnessed in the 10-year US Treasury bond yield helped the US Dollar Index (DXY), which was last seen posting small daily losses at 92.55, limit its fall.
On Thursday, Christine Lagarde, President of the Europen Central Bank (ECB), is scheduled to deliver a speech at 1200 GMT. Later in the day, the weekly Initial Jobless Claims and August Retail Sales data from the US will be looked upon for fresh impetus. Investors expect Retail Sales to contract by 0.8% and a weaker-than-forecast reading could weigh on the USD and allow EUR/USD to edge higher and vice versa.
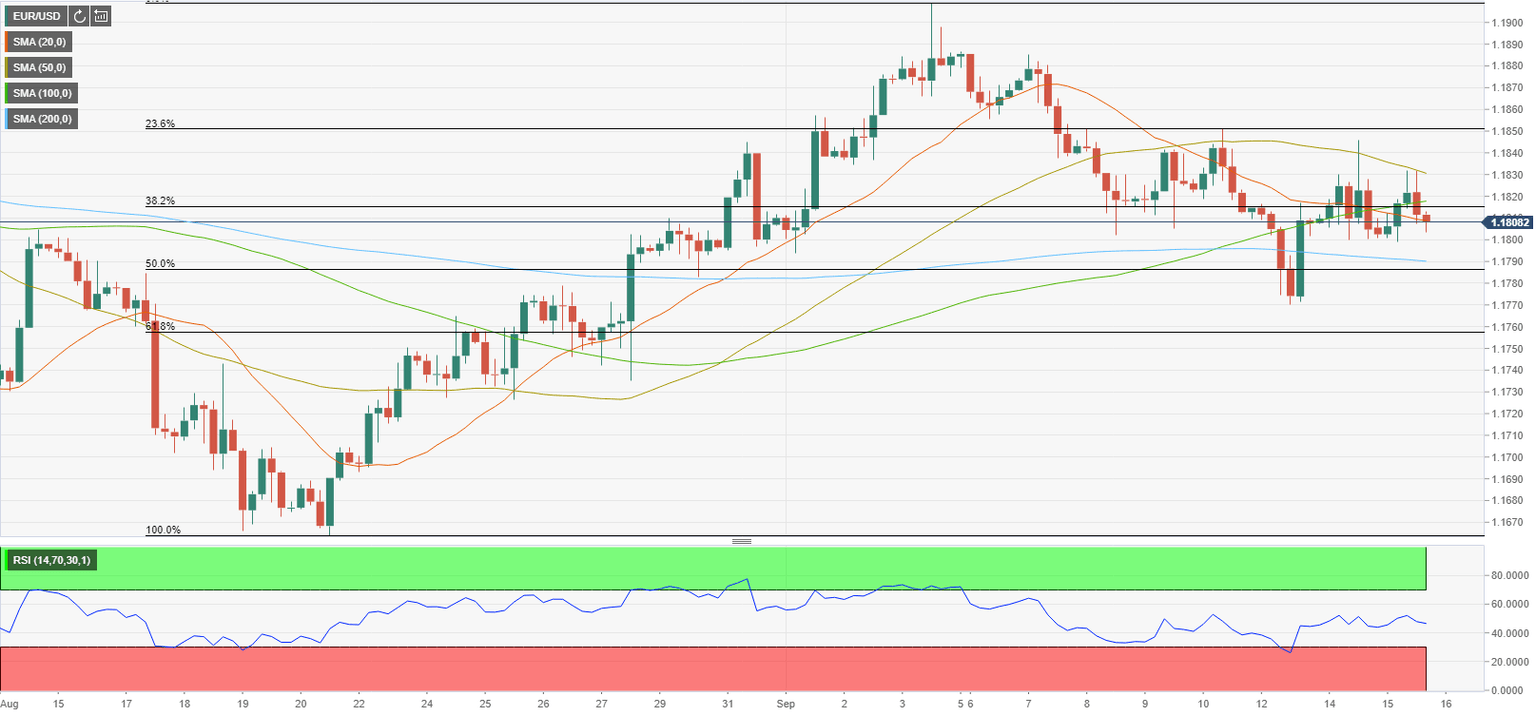
EUR/USD short-term technical outlook
On the four-hour chart, EUR/USD continues to trade below the 50 and 100-period SMAs. Nonetheless, the technical developments don't point to a bearish shift in the near-term outlook. The Relative Strength Index (RSI) indicator on the same chart continues to move sideways around 50, reflecting the neutral bias. Sellers could look to dominate EUR/USD action with a daily close below 1.1790, where the 200-period SMA and the Fibonacci 50% retracement of the late-August early-September uptrend is located.
Support levels: 1.1790 1.1760 1.1700
Resistance levels: 1.1815 1.1830 1.1850
Premium
You have reached your limit of 3 free articles for this month.
Start your subscription and get access to all our original articles.
Author

Eren Sengezer
FXStreet
As an economist at heart, Eren Sengezer specializes in the assessment of the short-term and long-term impacts of macroeconomic data, central bank policies and political developments on financial assets.


