EUR/USD Forecast: Bulls struggle to take control as key resistance holds
- EUR/USD reached a daily high of 1.1846 on Tuesday.
- USD lost its strength after Core CPI came in lower than expected.
- Risk-averse market environment doesn't allow EUR/USD to gather bullish momentum.

Following Monday's choppy session, the EUR/USD pair stayed relatively quiet during the European trading hours on Tuesday. With the greenback coming under modest selling pressure in the early American session, the pair gained traction and reached a daily high of 1.1846. Nevertheless, the negative shift witnessed in risk sentiment didn't allow the pair to preserve its bullish momentum in the second half of the day and forced it to end the day a little above Monday's closing level of 1.1808.
The data published by the US Bureau of Labor Statistics revealed on Tuesday that inflation in the US, as measured by the Consumer Price Index (CPI), edged lower to 5.3% on a yearly basis in August from 5.4% in July as expected. More importantly, the Core CPI, which excludes volatile energy and food prices, declined to 4% from 4.3%, coming in lower than analysts' estimate of 4.2%.
Reflecting the negative impact of the inflation data on the USD, the US Dollar Index (DXY) fell to a daily low of 92.32 in the hour following the release.
However, Wall Street's main indexes turned negative on the day after opening higher and helped the greenback find demand as a safe haven, capping EUR/USD's upside.
On Wednesday, July Industrial Production data will be featured in the European economic docket. Additionally, the US Federal Reserve will release the Industrial Production and Capacity Utilization figures for August. These data are unlikely to trigger a significant market reaction and the USD's market valuation via market mood is expected to continue to drive EUR/USD's movements.
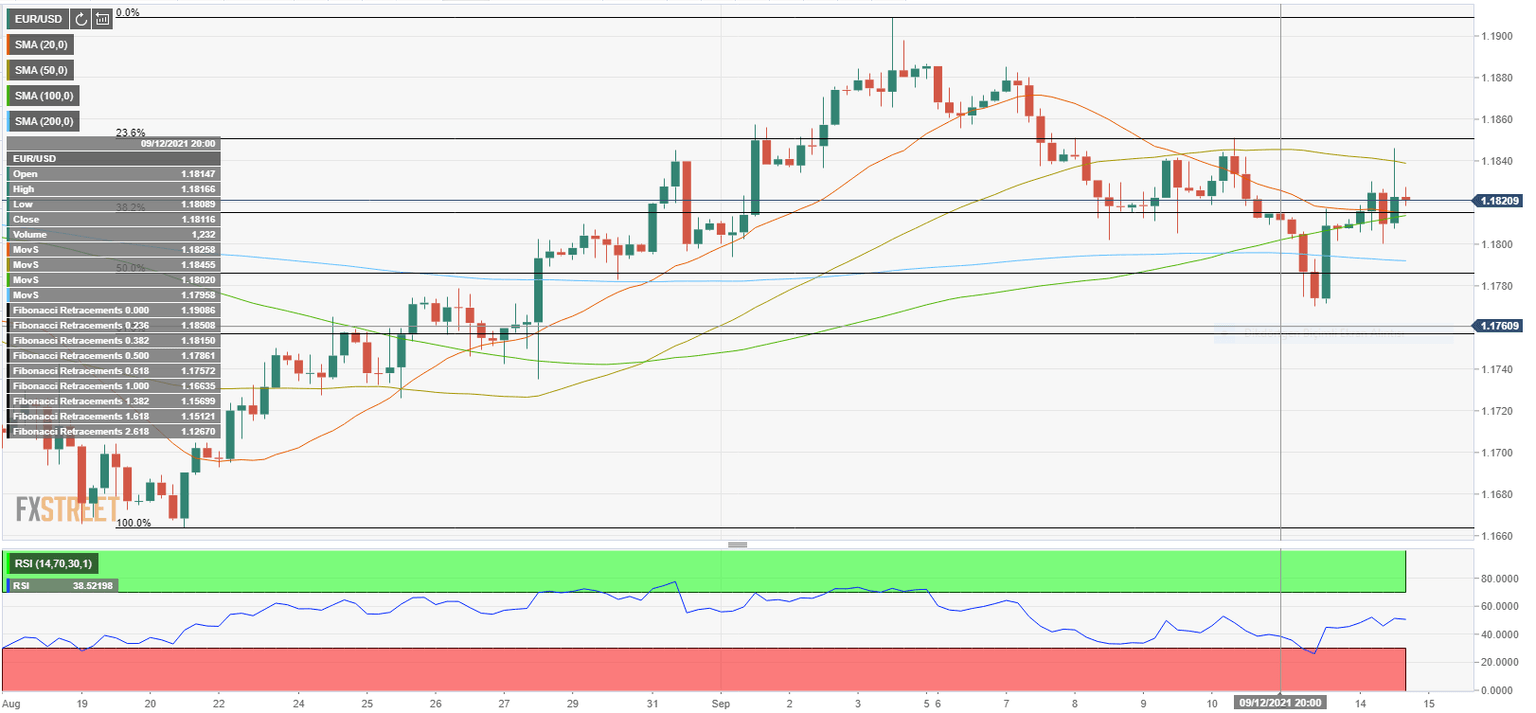
EUR/USD short-term technical outlook
Following the upsurge seen in the early American session, EUR/USD returned below the 20, 50 and 100-period SMAs on the four-hour chart. Moreover, the Relative Strength Index (RSI) indicator on the same chart failed to hold above 50, suggesting that bulls are having a tough time staying in control of the action. The bearish pressure could increase with a daily close below 1.1790, where the 200-period SMA and the Fibonacci 50% retracement of the late-August early-September uptrend is located.
Support levels: 1.1790 1.1760 1.1700
Resistance levels: 1.1815 1.1850 1.1910
Premium
You have reached your limit of 3 free articles for this month.
Start your subscription and get access to all our original articles.
Author

Eren Sengezer
FXStreet
As an economist at heart, Eren Sengezer specializes in the assessment of the short-term and long-term impacts of macroeconomic data, central bank policies and political developments on financial assets.


