EUR/USD Forecast: Quiet consolidation continues despite fresh concerns

EUR/USD Current Price: 1.0638
- US government bond yields advanced amid fears inflation could pick up on China’s reopening.
- The macroeconomic calendar will offer some minor US figures on Wednesday.
- EUR/USD extends its consolidative phase above the 1.0600 threshold.
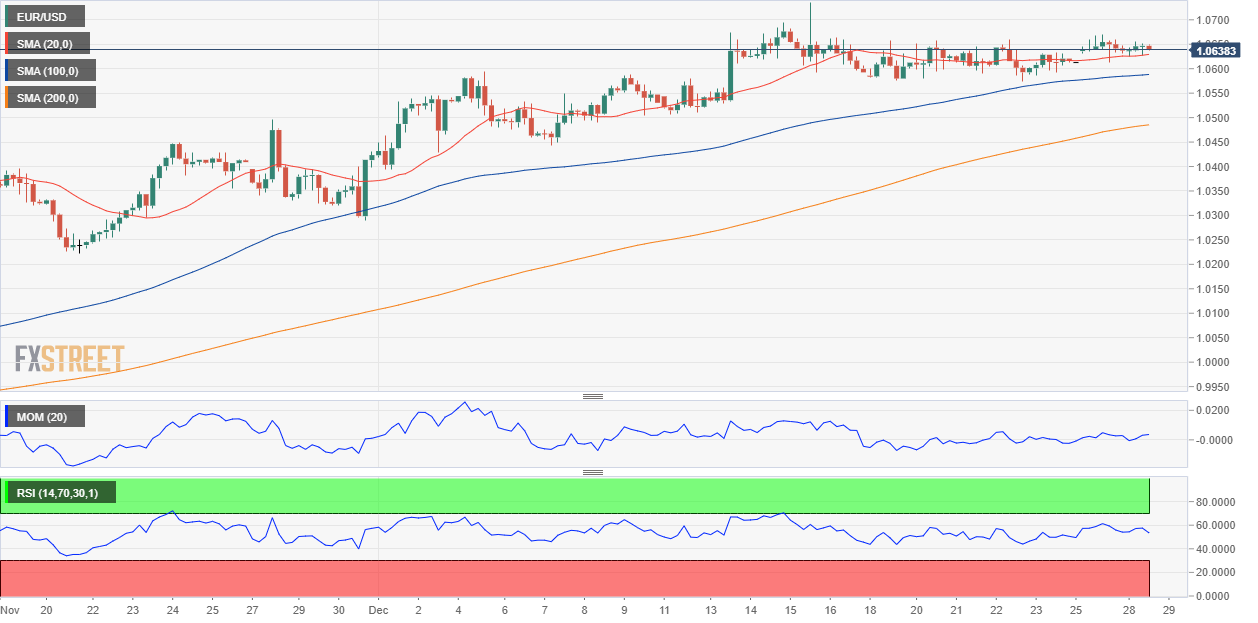
The EUR/USD pair trades little changed in the 1.0640 price zone, with the US Dollar taking some advantage amid easing optimism. Attention is on the poor performance of Asian equities and rising US government bond yields. Optimism about China’s reopening fueled stock markets on Tuesday, but as investors digested the news, the focus shifted to the impact it could have on global inflation.
The 10-year US Treasury note yield stands at 3.82%, more than double the roughly 1.5% it offered at the end of 2021. The 2-year note currently yields 4.32% after paying around 0.75% at the beginning of the year. One thing leads to another, as speculation inflation could rise again, pushing yields at the shorter end of the curve higher, which in turn, fuels concerns about a potential recession.
Data-wise, there’s nothing of interest to take care of. Europe did not publish macroeconomic figures, while later in the session, the US will publish November Pending Home Sales and the December Richmond Fed Manufacturing Index.
EUR/USD short-term technical outlook
The EUR/USD pair is unchanged for a second consecutive day, confined to a tight 30 pips range. Still, technical readings show that the risk remains skewed to the upside. In the daily chart, EUR/USD trades above all of its moving averages, with the 20 Simple Moving Average (SMA) still heading north above the longer ones and below the current level. The Momentum indicator has lost directional strength but holds within positive levels, while the Relative Strength Index (RSI) consolidates at around 64.
In the near term, and according to the 4-hour chart, the pair retains its neutral-to-bullish stance. EUR/USD meets buyers around a flat 20 SMA, which develops above the longer ones. Technical indicators, however, head nowhere, standing just above their midlines.
Support levels: 1.0620 1.0580 1.0535
Resistance levels: 1.0660 1.0695 1.0740
Author

Valeria Bednarik
FXStreet
Valeria Bednarik was born and lives in Buenos Aires, Argentina. Her passion for math and numbers pushed her into studying economics in her younger years.

















