EUR/USD Forecast: Quarter-end flows could boost the euro
- EUR/USD has gone into a consolidation phase above 0.9800.
- Hot inflation data from the euro area failed to lift the shared currency.
- Quarter-end flows could help the pair extend its rebound ahead of the weekend.

EUR/USD capitalized on the broad-based selling pressure surrounding the greenback and climbed above 0.9800 on Friday. The pair seems to have gone into a consolidation phase ahead of the key inflation data from the US. Quarter-end flows could help the euro end the week on a firm footing.
Although markets remained risk-averse on Thursday, the dollar struggled to find demand and the US Dollar Index (DXY) lost nearly 1% on a daily basis. The beginning of the overdue technical correction in the DXY and retreating US Treasury bond yields helped EUR/USD preserve its recovery momentum in the second half of the week.
Meanwhile, the data published by Eurostat revealed on Friday that inflation in the euro area, as measured by the Harmonised Index of Consumer Prices (HICP), climbed to 10% on a yearly basis in September from 9.1% in August. This reading came in higher than the market expectation of 9.7% but its impact on the euro's market valuation was short-lived.
In the second half of the day, the Personal Consumption Expenditures (PCE) Price Index, the Fed's preferred gauge of inflation, data from the US will be looked upon for fresh impetus. Investors expect the Core PCE Price Index to come in at 0.5% on a monthly basis in August. Unless this data surpasses analysts' estimates by a considerable margin, it is unlikely to provide a boost to the dollar because investors already know price pressures rose in August following the Consumer Price Index report.
Wall Street's main indexes remain on track to open decisively higher. In case the risk rally stays intact after the PCE inflation report, the dollar is likely to continue to lose interest ahead of the weekend. Profit-taking on the last trading day of the third quarter could also help EUR/USD preserve its bullish momentum.
EUR/USD Technical Analysis
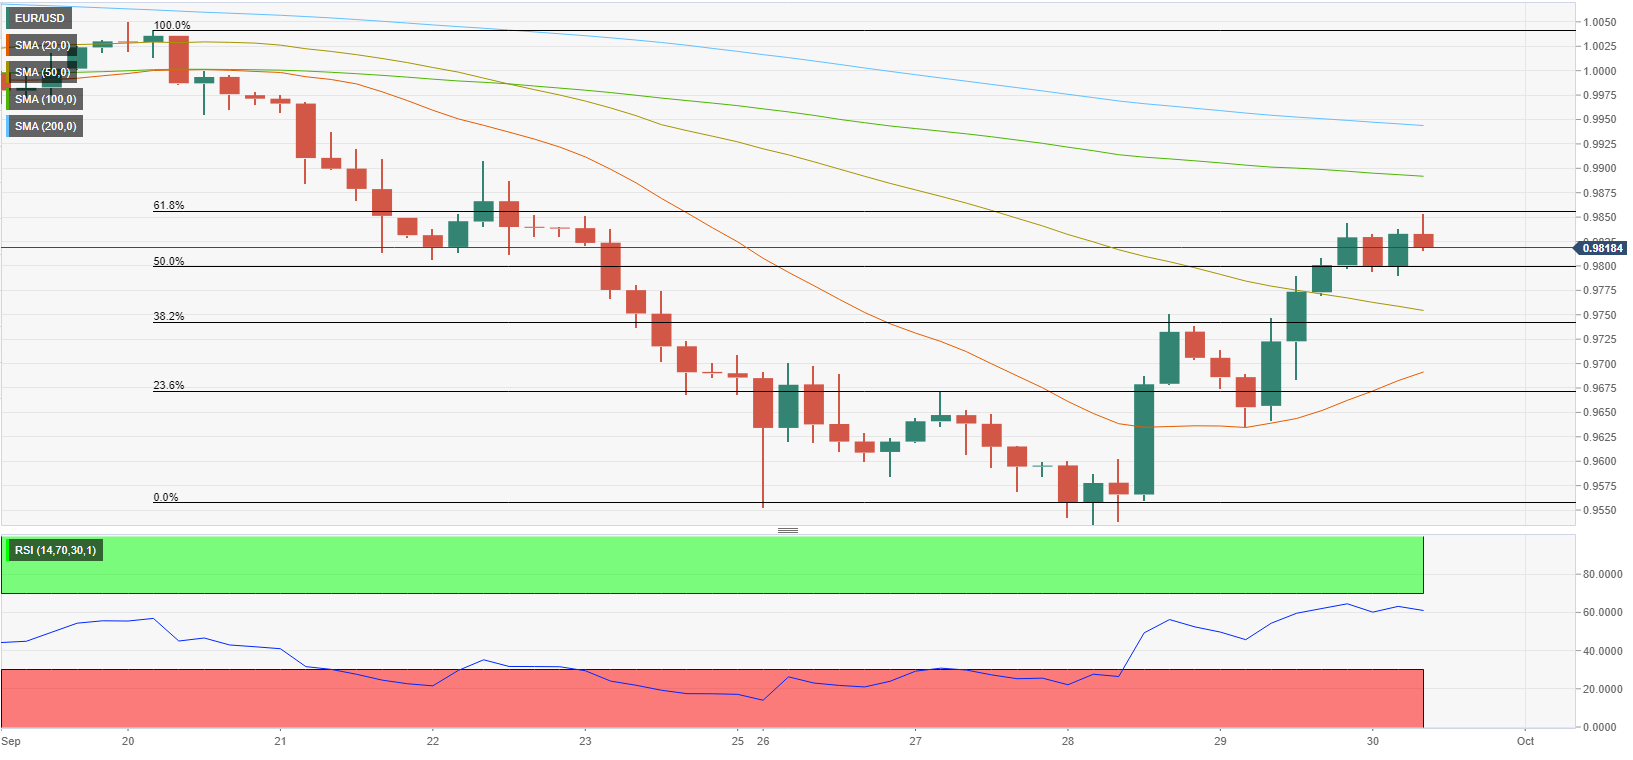
The Relative Strength Index (RSI) indicator on the four-hour chart holds above 50 and the pair continues to trade above the 50-period SMA, confirming the bullish bias. On the upside, 0.9850 (Fibonacci 61.8% retracement of the latest downtrend) aligns as initial resistance. With a four-hour close above that level, the pair could target 0.9900 (psychological level, 100-period SMA) and 0.9950 (200-period SMA).
Supports are located at 0.9800 (Fibonacci 50% retracement), 0.9750 (Fibonacci 38.2% retracement, 50-period SMA) and 0.9700 (psychological level, 20-period SMA).
Premium
You have reached your limit of 3 free articles for this month.
Start your subscription and get access to all our original articles.
Author

Eren Sengezer
FXStreet
As an economist at heart, Eren Sengezer specializes in the assessment of the short-term and long-term impacts of macroeconomic data, central bank policies and political developments on financial assets.


