EUR/USD Forecast: Outlook should shift to bearish below the 200-day SMA
- EUR/USD put the 1.0800 region to the test on Monday.
- The Dollar kicked off the week on a positive note.
- The next salient release will be Germany’s flash CPI.

EUR/USD succumbed to the firm start to the week by the Greenback, reversing two daily gains in a row and flirting with three-day lows near the 1.0800 region on Monday.
Conversely, the US Dollar (USD) managed to come roaring and advance to multi-day tops near 104.80, reclaiming at the same time the area beyond the critical 200-day SMA (104.33).
In addition, daily gains in the pair came pari passu with further weakness in US and German yields, at a time when investors expect both the Federal Reserve (Fed) and the European Central Bank (ECB) to cut their rates after the summer break.
In terms of monetary policy, the Fed is largely expected to maintain its rates at its July 31 meeting, while investors anticipate the central bank setting the stage for the start of the easing cycle in September.
An interest rate cut by the ECB in September has also been suggested by recent comments from Vice President Luis de Guindos.
The policy divergence between the Fed and the ECB should remain nearly unchanged, with both central banks forecast to cut rates in the next couple of months. However, the expectation of a soft landing in the US economy contrasts with some loss of momentum in the Eurozone's economic recovery, potentially leading to further weakness in European currency in the medium-term horizon.
Moving forward, market participants will closely follow the release of the preliminary Q2 GDP Growth Rate in both Germany and the euro bloc, as well as the advanced Inflation Rate in Germany, all due on July 30.
EUR/USD daily chart
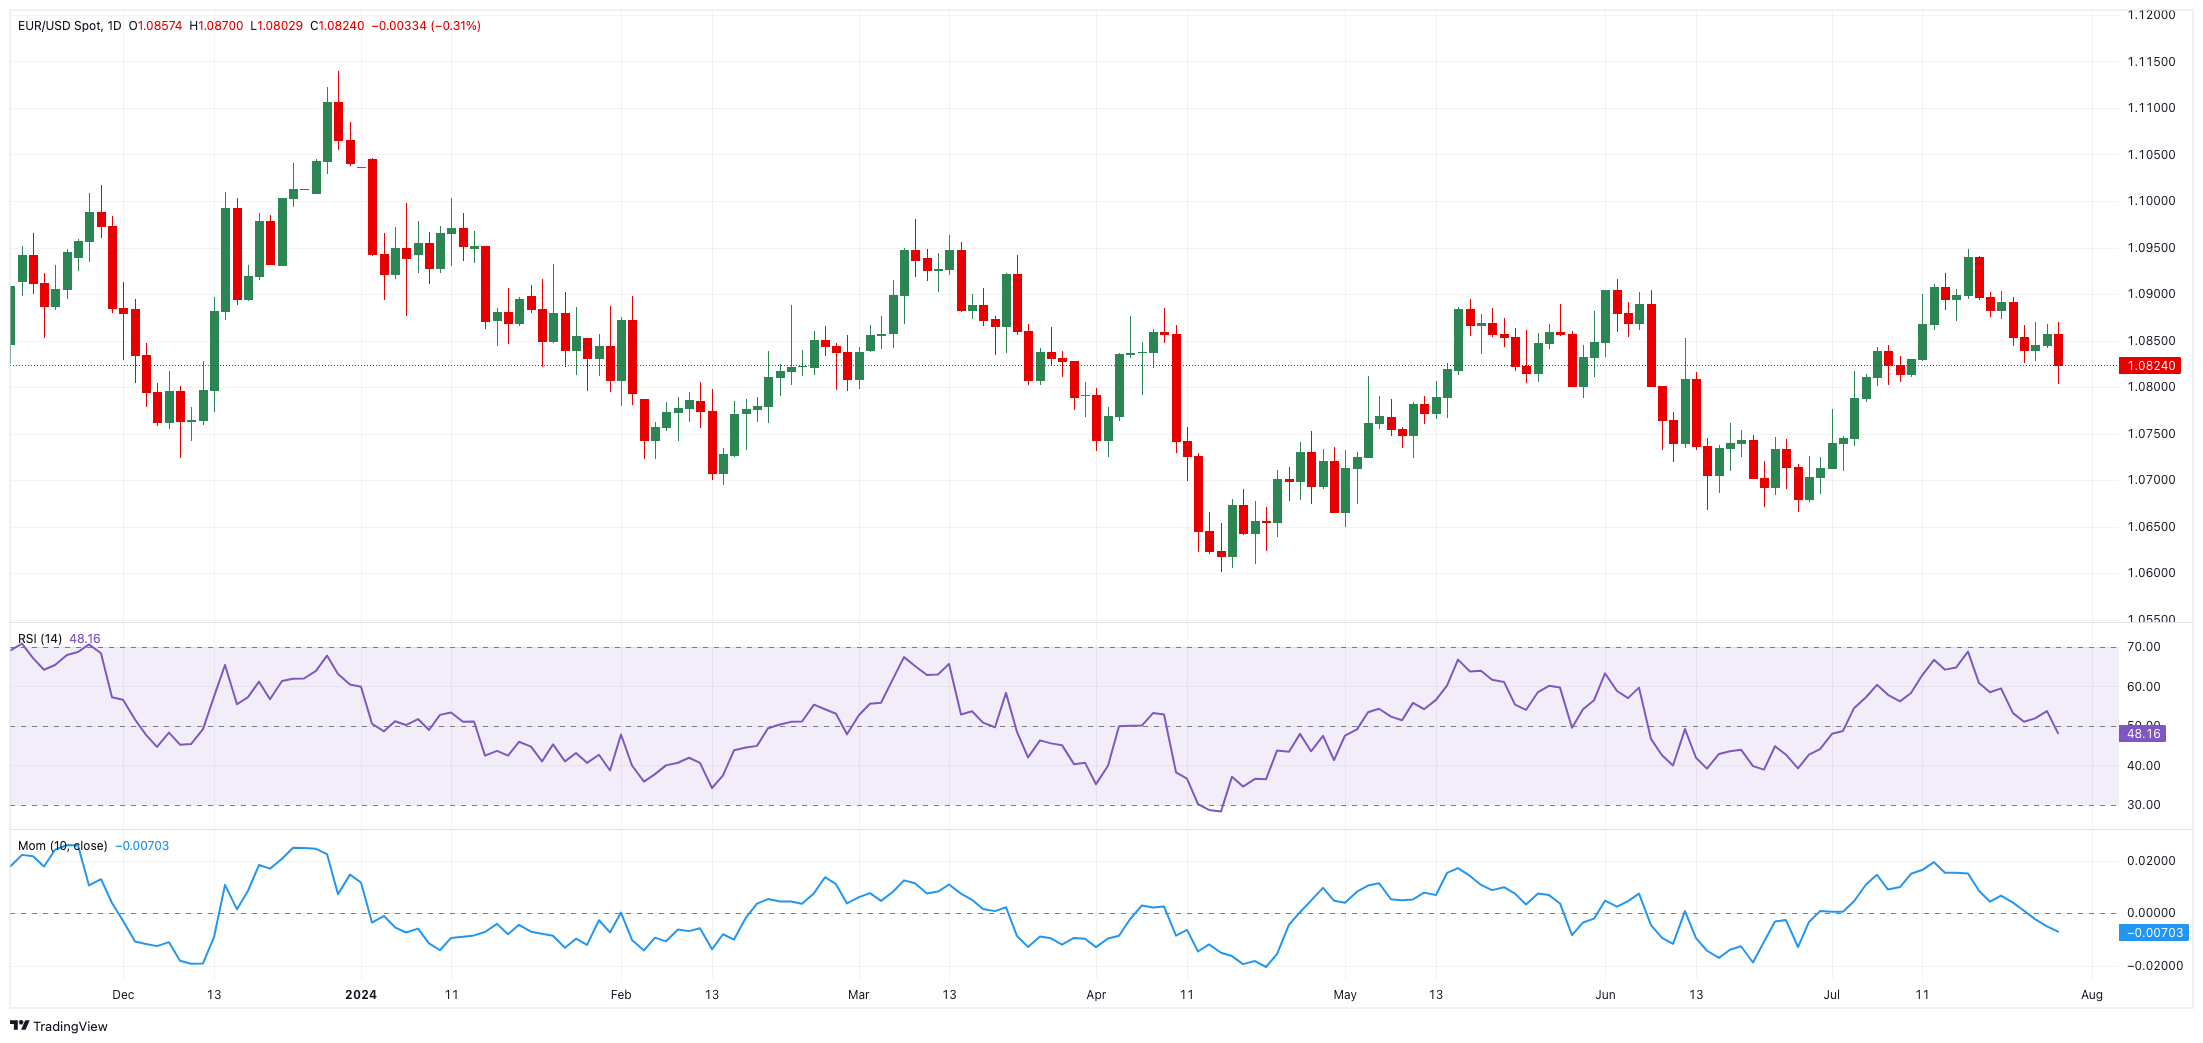
EUR/USD short-term technical outlook
The weekly low of 1.0802 (July 29) is next on the downside for EUR/USD ahead of. The provisional 100-day SMA at 1.0796. Down from here comes the June low of 1.0666 (on June 26), ahead of the May low of 1.0649 (May 1).
On the other hand, early resistance is indicated at the July high of 1.0948 (July 17), followed by the March top of 1.0981 (March 8) and the important 1.1000 milestone.
Looking at the big picture, the negative bias should return to the pair if it stays below the crucial 200-day SMA (1.0820).
So far, the four-hour chart indicates some acceleration of the downward bias. Nonetheless, the 55-SMA at 1.0875 serves as early resistance, followed by 1.0948, 1.0981, and ultimately 1.1000. On the other hand, 1.0802 is first, followed by the 200-SMA at 1.0800 and then 1.0709. The relative strength index (RSI) bounced to around 38.
Premium
You have reached your limit of 3 free articles for this month.
Start your subscription and get access to all our original articles.
Author

Pablo Piovano
FXStreet
Born and bred in Argentina, Pablo has been carrying on with his passion for FX markets and trading since his first college years.


