EUR/USD Forecast: Nearing the critical 1.0280 resistance

EUR/USD Current Price: 1.0240
- Russia reportedly suspended oil flows to Europe through the Druzhba pipeline.
- US data surprised to the upside, underpinning high-yielding assets.
- EUR/USD is mildly bullish but still trading inside the latest range.
The dollar remained on the back foot throughout the first half of the day, helping EUR/USD to reach an intraday high of 1.0247. The EUR and the GBP advanced despite a sour market mood, catching up after lagging on Monday, without a certain catalyst backing their modest gains. Still, the EUR/USD pair remains within familiar levels.
Market participants remain cautious ahead of the release of the US Consumer Price Index on Wednesday, as the figures would set the tone of the Federal Reserve’s September meeting. Meanwhile, concerns about economic progress persist. The shared currency retreated on the back of headlines indicating that Russia reportedly suspended oil flows via the southern leg of the Druzhba pipeline, blaming it on transit payment issues.
Data-wise, the EU macroeconomic calendar had nothing to offer, while the US has just released Q2 Nonfarm Productivity, which decreased by 4.6% QoQ, and Unit Labor Cost for the same period, up 10.8%, both beating the market’s expectations. The positive data underpinned stocks, which weighed on the dollar. Later in the American session, the country will publish August IBD/TIPP Economic Optimism.
EUR/USD short-term technical outlook
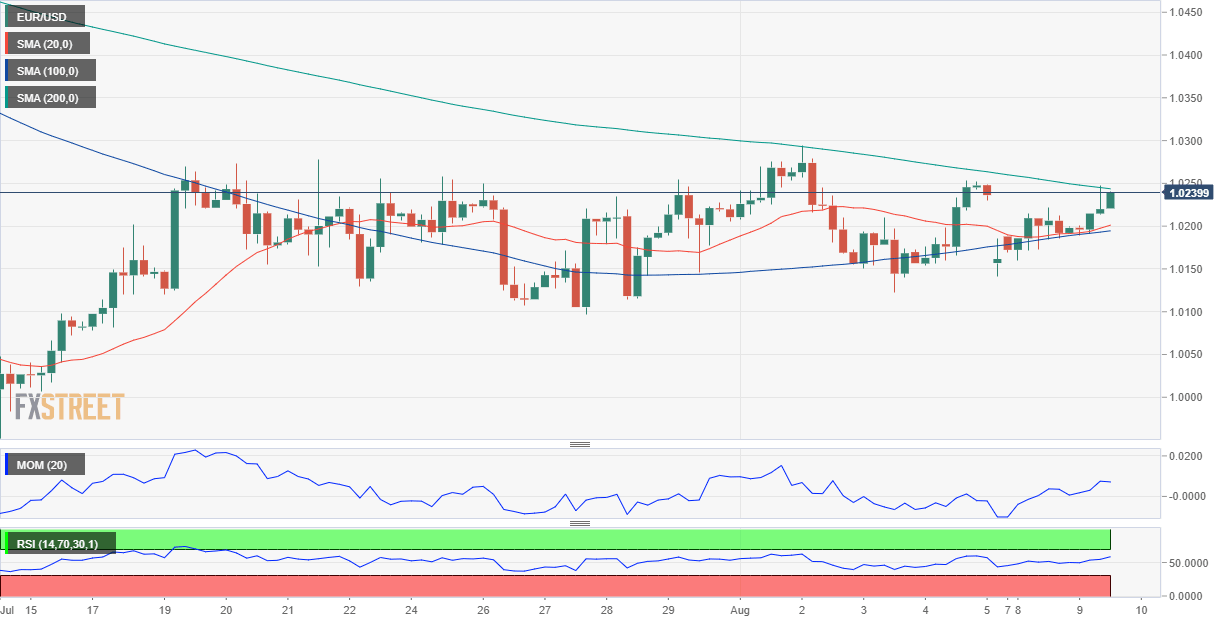
The EUR/USD pair surpassed a Fibonacci level at 1.0205 and trades halfway towards the next one, the 50% retracement of its latest daily slide at 1.0280. The latter has been capping advances since mid-July. Technical readings in the daily chart skew the risk to the upside, as the pair continues to find buyers around a mildly bullish 20 SMA, while technical indicators bounced from around their midlines.
The 4-hour chart shows that the pair is still neutral. Technical indicators remain directionless, the Momentum around its midline and the RSI at around 58. At the same time, the 20 and 100 SMA stand around the aforementioned Fibonacci support, while a bearish 200 SMA contains advances, converging with the daily high.
Support levels: 1.0205 1.0150 1.0105
Resistance levels: 1.0280 1.0325 1.0360
Premium
You have reached your limit of 3 free articles for this month.
Start your subscription and get access to all our original articles.
Author

Valeria Bednarik
FXStreet
Valeria Bednarik was born and lives in Buenos Aires, Argentina. Her passion for math and numbers pushed her into studying economics in her younger years.


