EUR/USD Forecast: Modest recovery falling short of supporting more gains

EUR/USD Current Price: 1.0544
- Escalating tensions in the Middle East maintain investors in cautious mode.
- Stocks trade with modest optimism as market participants await earnings reports.
- EUR/USD is at risk of resuming its decline despite the modest intraday recovery.
The EUR/USD pair trades in the 1.0540 region ahead of Wall Street’s opening, marginally higher on the day. The pair bottomed at 1.0495 on Friday, as Middle-East tensions and higher-than-expected United States (US) inflation figures spurred demand for the safe-haven US Dollar.
The war between Israel and Hamas continued to escalate over the weekend, with Israel preparing a massive attack on the Gaza Strip and Hezbollah joining the conflict, yet financial markets are not reflecting it. In fact, the week started with Asian shares under pressure, although European ones trade in the green, leading to modest gains in US futures. In the meantime, government bond yields recovered some ground ahead of the American opening, putting mild pressure on the USD.
Data-wise, Germany released the September Wholesale Price Index, which rose 0.2% MoM but declined by 4.1% from a year earlier. The Euro Zone unveiled the August Trade Balance, which posted a seasonally adjusted surplus of €11.9 billion, much better than the previous €3.5 billion. As for the US, the country has just published the NY Empire State Manufacturing Index, down to -4.6 in the month from 1.9 in September.
The macroeconomic calendar will include a Federal Reserve (Fed) speaker in the American afternoon, with attention also centring on the last earning season of the year.
EUR/USD short-term technical outlook
The daily chart for EUR/USD shows the advance remains corrective. The pair trades below a bearish 20 Simple Moving Average (SMA), which maintains a firmly downward slope far below the longer ones, providing dynamic resistance at around 1.0570. At the same time, technical indicators advance, although within negative levels. The Relative Strength Index (RSI) indicator stands at around 42, well below Friday’s peak, suggesting limited buying interest.
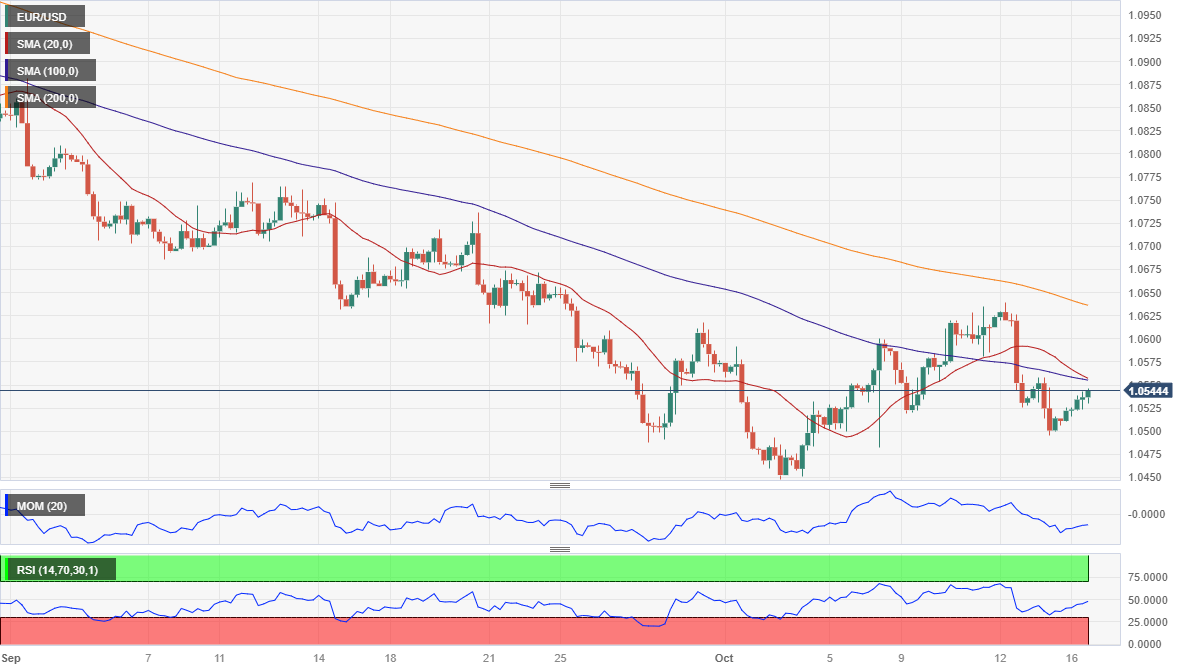
The risk skews to the downside in the near term and, according to the 4-hour chart. All moving averages head south above the current level, with the 20 and 100 SMAs in the 1.0560/70 area, reinforcing the resistance area. At the same time, technical indicators are slowly grinding south within negative levels, anticipating another leg south without confirming it.
Support levels: 1.0495 1.0450 1.0400
Resistance levels: 1.0570 1.0610 1.0650
Author

Valeria Bednarik
FXStreet
Valeria Bednarik was born and lives in Buenos Aires, Argentina. Her passion for math and numbers pushed her into studying economics in her younger years.
















