EUR/USD Forecast: Losing bullish momentum, but far from bearish

EUR/USD Current Price: 1.1842
- The second estimate of the EU Q2 GDP matched the preliminary estimate at -12.1%.
- US Retail Sales improved by less than anticipated in July, up a modest 1.2%.
- The EUR/USD bullish potential receded but bears nowhere to be found.
The EUR/USD pair finished a seventh consecutive week with gains in the 1.1840 price zone, advancing on Friday on the back of persistent dollar’s weakness and mixed US data. The greenback has been on the backfoot amid mounting tensions with China and the lack of progress among Congressmen over a stimulus package. In fact, the Congress has left for a month-long recess on Thursday, which only escalates concerns about the US economy. As for tensions with China, news on Friday indicated that a review of the trade deal that was supposed to take place over the weekend had been postponed without any new date scheduled.
By the end of the week, the EU reported the second estimate of Q2 GDP, which matched the preliminary estimate at -12.1%, while in the same three months to June, the EU Employment Change dropped 2.8%, worse than anticipated. In the US, the headline reading of July Retail Sales missed expectations, as sales were up by 1.2% in the month vs the 1.9% expected. Sales ex-autos, however, improved to 1.9%, while Retail Sales Control Group surged 1.4%, beating the expected 0.8%. Finally, the preliminary estimate of the Michigan Consumer Sentiment Index for August resulted at 72.8 from 72.5 in July. The news helped in keeping equities afloat, which in turn put a cap to the dollar’s gains. The macroeconomic calendar will be quite light for these economies on Monday.
EUR/USD short-term technical outlook
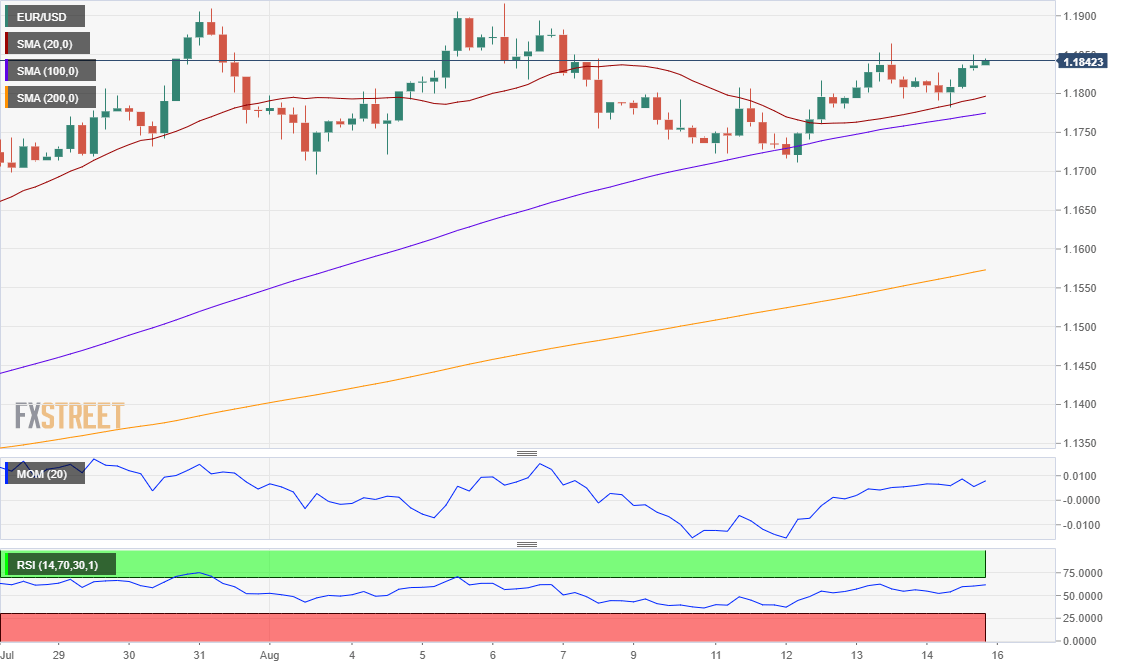
The daily chart of the EUR/USD pair shows that it has held above the 23.6% retracement of its July/August rally at 1.1740, also above a firmly bullish 20 DMA, which converges with the mentioned Fibonacci level. The Momentum indicator, however, heads firmly lower within positive levels, nearing its 100 line. The RSI has retreated from its recent highs and is stable at around 67, suggesting the pair may soon face a corrective decline. In the shorter-term, the 4-hour chart indicates decreasing buying interest but is far from suggesting an upcoming decline. The pair is holding above bullish moving averages, but technical indicators turned south within positive levels.
Support levels: 1.1830 1.1790 1.1740
Resistance levels: 1.1870 1.1915 1.1950
Author

Valeria Bednarik
FXStreet
Valeria Bednarik was born and lives in Buenos Aires, Argentina. Her passion for math and numbers pushed her into studying economics in her younger years.


