EUR/USD Forecast: Further gains look to US PCE
- EUR/USD regained traction and bounced off the sub-1.0800 region.
- The US Dollar lost momentum along with US yields.
- Investors’ attention now shifts to the US PCE.

The US Dollar (USD) traded on the defensive, lending some much-needed oxygen to the risk-associated space and prompting EUR/USD to change course after bottoming out in the sub-1.0800 zone early on Thursday.
The pair left behind two daily declines in a row amidst an accelerating downward impulse in the Greenback and a marked drop in US yields across the curve.
In the meantime, speculation that the Federal Reserve (Fed) might maintain its restrictive stance longer than anticipated remained well on the rise, bolstered by recent hawkish comments from Fed officials.
According to the CME Group’s FedWatch Tool, the probability of lower interest rates by the November 7 meeting hovers at nearly 64%.
Regarding the European Central Bank (ECB), higher inflation figures in Germany in May dampened expectations of a rate cut in June, ahead of the release of the flash CPI for the broader Eurozone on Friday.
Looking ahead, the relatively subdued economic fundamentals in the Eurozone, coupled with the resilience of the US economy, reinforce the ongoing narrative of Fed-ECB policy divergence and suggest a stronger Dollar in the long run. Given the rising likelihood of the ECB reducing rates before the Fed, the potential for further weakness in EUR/USD should be considered in the medium term.
EUR/USD daily chart
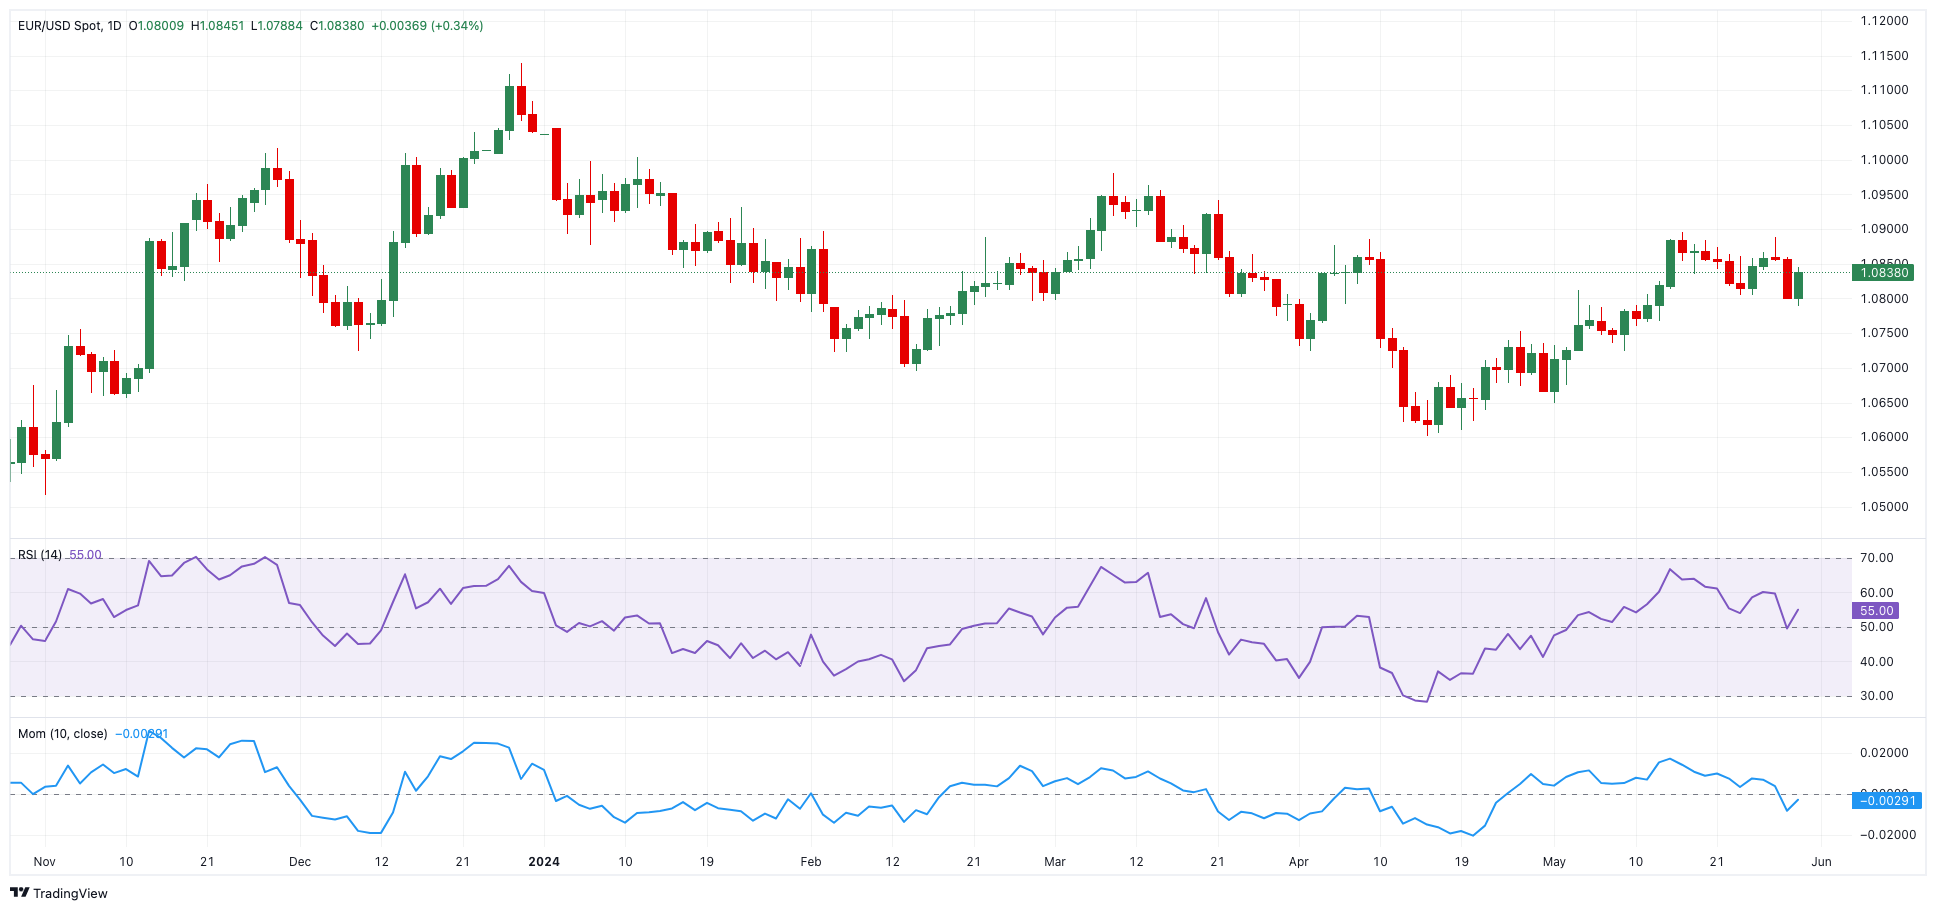
EUR/USD short-term technical outlook
Extra weakness may push the EUR/USD to the 200-day SMA of 1.0787 before the May low of 1.0649 (May 1), ahead of the 2024 bottom of 1.0601 (April 16) and the November 2023 low of 1.0516 (November 1). Once this zone is cleared, the pair may target the weekly low of 1.0495 (October 13, 2023), the 2023 bottom of 1.0448 (October 3), and the 1.0400 round milestone.
If bulls get the upper hand, EUR/USD may revisit the May high of 1.0894 (May 16), followed by the March top of 1.0981 (March 8) and the weekly peak of 1.0998 (January 11), all before reaching the key 1.1000 mark.
So far, the 4-hour chart shows a robust rebound. The 55-SMA at 1.0845 serves as the next upward hurdle, followed by 1.0894 and 1.0942. Looking south, 1.0788 comes first, followed by 1.0766 and the 200-SMA of 1.0760. The relative strength index (RSI) climbed past 50.
Premium
You have reached your limit of 3 free articles for this month.
Start your subscription and get access to all our original articles.
Author

Pablo Piovano
FXStreet
Born and bred in Argentina, Pablo has been carrying on with his passion for FX markets and trading since his first college years.


