EUR/USD Forecast: European gas crisis takes its toll on the shared currency

EUR/USD Current Price: 1.0133
- EU authorities are planning to reduce gas use next winter to compensate for the shortage.
- US CB Consumer Confidence is expected to have plummeted to 97.3 in July.
- EUR/USD plunged amid risk aversion and trades near critical support at 1.0105.
The EUR/USD pair lost the 1.0200 threshold and fell to 1.0115, currently trading a handful of pips above the latter. The American dollar appreciated on the back of risk aversion, as concerns about a potential recession continue to affect investors’ mood. US government bond yields remain far below their panic highs, but the yield curve is the most inverted since 2000. 2-year Treasuries are yielding 2.99%, while the 10-year note yields 2.81%. An inverted curve is usually a sign of an upcoming recession.
Meanwhile, tensions between the EU and Russia escalate. The latter has resumed gas provision through Nord Stream 1 after the annual maintenance but reduced the delivery to around 20% of the pre-Ukraine invasion levels. EU countries agreed to reduce gas use for next winter, aiming to cut gas use by 15% in the upcoming six months. Meanwhile, Moscow reported that the missing turbine for the pipeline is on its way after maintenance, but it still has not been installed.
The EU calendar had nothing relevant to offer, while the US will publish the May Housing Price Index, July CB Consumer Confidence, June New Home Sales and the July Richmond Fed Manufacturing Index.
EUR/USD short-term technical outlook
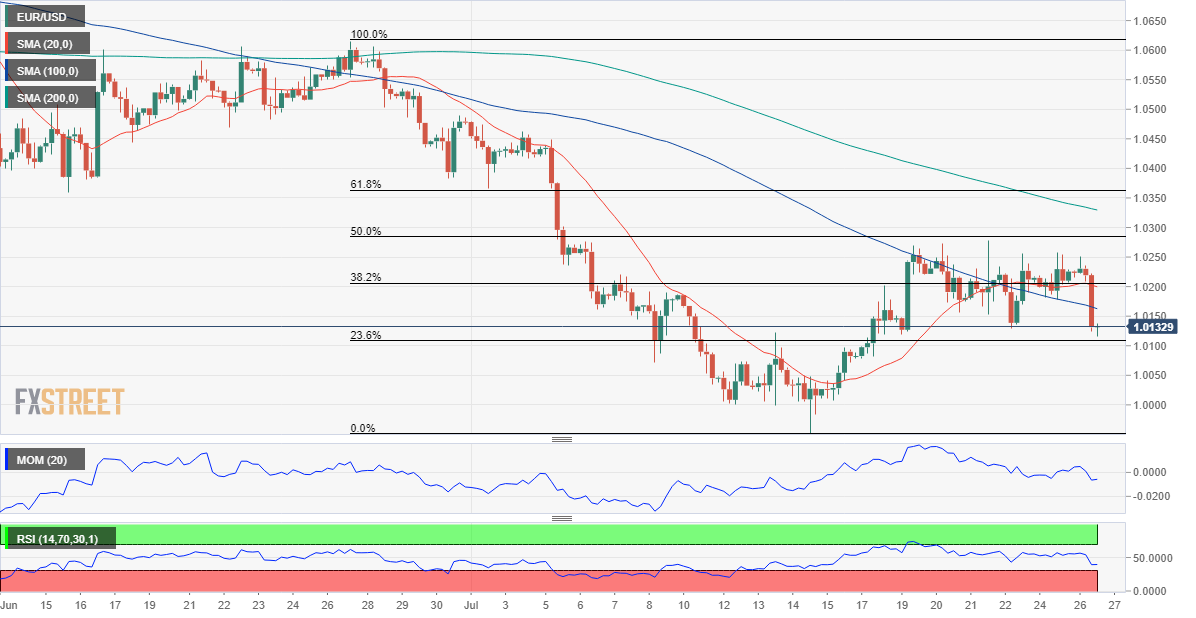
The EUR/USD pair is trading at its lowest in a week and near the 23.6% retracement of its latest daily slide at 1.0105, the immediate support level. The 38.2% Fibonacci retracement provides resistance around 1.0205.
Technically, the daily chart shows that the pair plunged after repeatedly failing to overcome a bearish 20 SMA, which maintains its firmly bearish slope below the longer ones. Technical indicators, in the meantime, have resumed their declines within negative levels, in line with a bearish continuation on a break below the aforementioned support.
The 4-hour chart favors a downward extension, as the pair broke below its 20 and 100 SMAs, both gaining downward traction. Technical indicators head sharply lower within negative levels, reflecting sellers’ strength.
Support levels: 1.0105 1.0070 1.0025
Resistance levels: 1.0155 1.0205 1.0250
Premium
You have reached your limit of 3 free articles for this month.
Start your subscription and get access to all our original articles.
Author

Valeria Bednarik
FXStreet
Valeria Bednarik was born and lives in Buenos Aires, Argentina. Her passion for math and numbers pushed her into studying economics in her younger years.


