• EUR/USD has gone into a consolidation phase following a four-day slide.
  • The pair faces stiff resistance at around 1.0750.
  • US PCE inflation data for April could trigger the next big action in EUR/USD.

EUR/USD edged higher on Friday following a four-day slide that saw the pair touch its weakest level in over two months near 1.0700. Still, the near-term technical outlooks is yet to reveal a bullish tilt in the short term and the next directional movement could be influenced by the Personal Consumption Expenditures (PCE) Price Index data from the US later in the day.

The upbeat macroeconomic data releases from the US revived expectations for one more Federal Reserve (Fed) interest-rate increase in June and provided a boost to the US Dollar (USD) on Thursday. The US Bureau of Economic Analysis revised the first-quarter annualized Gross Domestic Product growth to 1.3% from 1.1% initially estimated, while the weekly Initial Jobless Claims came in at 229,000 compared to market expectations of 245,000.

The annual Core PCE Price Index, the Fed's preferred gauge of inflation, is forecast to rise 4.6% in April, matching March's reading. On a monthly basis, core PCE inflation is expected to hold steady at 0.3%. In case the monthly reading comes in at or above 0.5%, markets could continue to lean toward one more Fed rate hike in June and help the US Dollar (USD) gather strength ahead of the weekend. On the other hand, a softer-than-expected number should limit the USD's gains and allow EUR/USD to extend its rebound.

According to the CME Group FedWatch Tool, the probability of the Fed leaving its policy rate unchanged in June fell below 60% from nearly 80% earlier in the week. The market positioning suggests that EUR/USD faces a two-way risk depending on PCE inflation data.

EUR/USD Technical Analysis

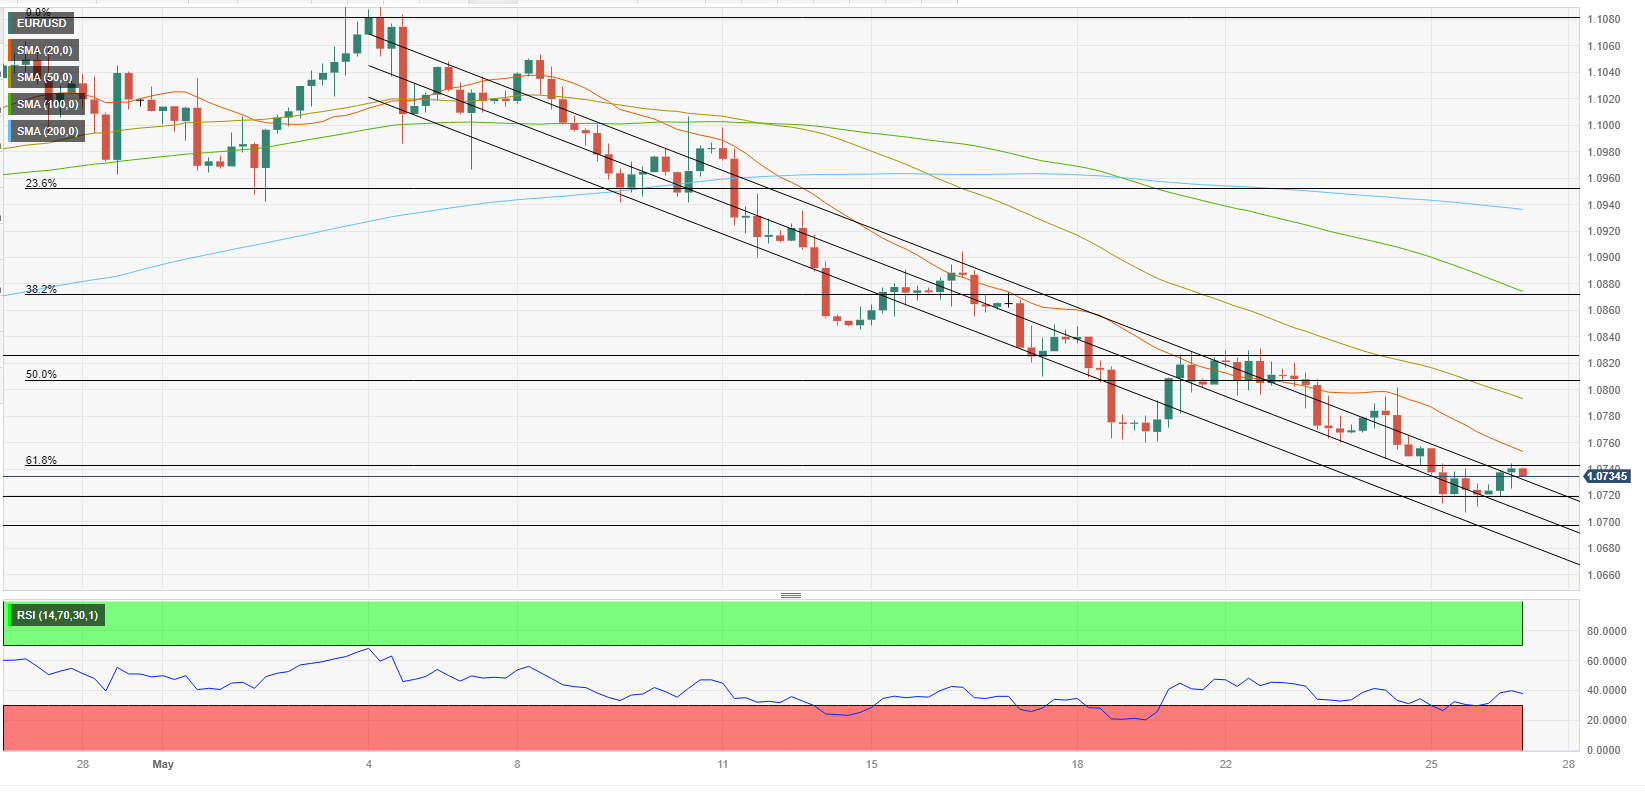
EUR/USD was last seen trading near the upper-limit of the descending regression channel near 1.0750. The Fibonacci 61.8% retracement level of the latest uptrend reinforces that figure as resistance. In case the pair manages to clear that hurdle and starts using it as support, it could extend its rebound toward 1.0800 (Fibonacci 50% retracement, 50-period Simple Moving Average) and 1.0830 (static level).

On the downside, interim support seems to have formed at 1.0720 (static level), ahead of 1.0700 (mid-point of the descending channel) and 1.0670 (lower-limit of the descending channel).

Information on these pages contains forward-looking statements that involve risks and uncertainties. Markets and instruments profiled on this page are for informational purposes only and should not in any way come across as a recommendation to buy or sell in these assets. You should do your own thorough research before making any investment decisions. FXStreet does not in any way guarantee that this information is free from mistakes, errors, or material misstatements. It also does not guarantee that this information is of a timely nature. Investing in Open Markets involves a great deal of risk, including the loss of all or a portion of your investment, as well as emotional distress. All risks, losses and costs associated with investing, including total loss of principal, are your responsibility. The views and opinions expressed in this article are those of the authors and do not necessarily reflect the official policy or position of FXStreet nor its advertisers. The author will not be held responsible for information that is found at the end of links posted on this page.

If not otherwise explicitly mentioned in the body of the article, at the time of writing, the author has no position in any stock mentioned in this article and no business relationship with any company mentioned. The author has not received compensation for writing this article, other than from FXStreet.

FXStreet and the author do not provide personalized recommendations. The author makes no representations as to the accuracy, completeness, or suitability of this information. FXStreet and the author will not be liable for any errors, omissions or any losses, injuries or damages arising from this information and its display or use. Errors and omissions excepted.

The author and FXStreet are not registered investment advisors and nothing in this article is intended to be investment advice.

Recommended Content


Recommended Content

Editors’ Picks

AUD/USD posts gain, yet dive below 0.6500 amid Aussie CPI, ahead of US GDP

AUD/USD posts gain, yet dive below 0.6500 amid Aussie CPI, ahead of US GDP

The Aussie Dollar finished Wednesday’s session with decent gains of 0.15% against the US Dollar, yet it retreated from weekly highs of 0.6529, which it hit after a hotter-than-expected inflation report. As the Asian session begins, the AUD/USD trades around 0.6495.

AUD/USD News

USD/JPY finds its highest bids since 1990, approaches 156.00

USD/JPY finds its highest bids since 1990, approaches 156.00

USD/JPY broke into its highest chart territory since June of 1990 on Wednesday, peaking near 155.40 for the first time in 34 years as the Japanese Yen continues to tumble across the broad FX market. 

USD/JPY News

Gold stays firm amid higher US yields as traders await US GDP data

Gold stays firm amid higher US yields as traders await US GDP data

Gold recovers from recent losses, buoyed by market interest despite a stronger US Dollar and higher US Treasury yields. De-escalation of Middle East tensions contributed to increased market stability, denting the appetite for Gold buying.

Gold News

Ethereum suffers slight pullback, Hong Kong spot ETH ETFs to begin trading on April 30

Ethereum suffers slight pullback, Hong Kong spot ETH ETFs to begin trading on April 30

Ethereum suffered a brief decline on Wednesday afternoon despite increased accumulation from whales. This follows Ethereum restaking protocol Renzo restaked ETH crashing from its 1:1 peg with ETH and increased activities surrounding spot Ethereum ETFs.

Read more

Dow Jones Industrial Average hesitates on Wednesday as markets wait for key US data

Dow Jones Industrial Average hesitates on Wednesday as markets wait for key US data

The DJIA stumbled on Wednesday, falling from recent highs near 38,550.00 as investors ease off of Tuesday’s risk appetite. The index recovered as US data continues to vex financial markets that remain overwhelmingly focused on rate cuts from the US Fed.

Read more

Majors

Cryptocurrencies

Signatures