EUR/USD Forecast: Euro could find direction after US data
- EUR/USD moves sideways below 1.1400 in the European session on Wednesday.
- Germany's GDP contracted at an annual rate of 0.2% in Q1.
- Private employment and growth data will be featured in the US economic calendar.

EUR/USD stays in a consolidation phase below 1.1400 after posting small losses on Tuesday. The near-term technical outlook points to a lack of directional momentum but key data releases from the United States (USD) could lift the pair's volatility.
Euro PRICE This week
The table below shows the percentage change of Euro (EUR) against listed major currencies this week. Euro was the weakest against the Japanese Yen.
| USD | EUR | GBP | JPY | CAD | AUD | NZD | CHF | |
|---|---|---|---|---|---|---|---|---|
| USD | -0.08% | -0.46% | -0.54% | -0.26% | 0.10% | 0.56% | -0.48% | |
| EUR | 0.08% | -0.44% | -0.45% | -0.19% | 0.08% | 0.64% | -0.42% | |
| GBP | 0.46% | 0.44% | -0.02% | 0.26% | 0.50% | 1.08% | 0.03% | |
| JPY | 0.54% | 0.45% | 0.02% | 0.31% | 0.68% | -0.30% | 0.37% | |
| CAD | 0.26% | 0.19% | -0.26% | -0.31% | 0.23% | 0.82% | -0.22% | |
| AUD | -0.10% | -0.08% | -0.50% | -0.68% | -0.23% | 0.57% | -0.49% | |
| NZD | -0.56% | -0.64% | -1.08% | 0.30% | -0.82% | -0.57% | -1.04% | |
| CHF | 0.48% | 0.42% | -0.03% | -0.37% | 0.22% | 0.49% | 1.04% |
The heat map shows percentage changes of major currencies against each other. The base currency is picked from the left column, while the quote currency is picked from the top row. For example, if you pick the Euro from the left column and move along the horizontal line to the US Dollar, the percentage change displayed in the box will represent EUR (base)/USD (quote).
The data from Germany showed on Tuesday that the Gross Domestic Product (GDP) contracted at an annual rate of 0.2% in the first quarter. This reading came in line with analysts' estimate and failed to trigger a noticeable market reaction. Later in the session, Eurozone GDP data and March Consumer Price Index figures from Germany will be featured in the European economic calendar.
In the early American session, Automatic Data Processing (ADP) will release the private sector employment data. Markets expect the ADP Employment Change to come in at 108K in April, down from 155K in March. More importantly, the US Bureau of Economic Analysis (BEA) will publish its first estimate of the annualized Gross Domestic Product (GDP) growth for the first quarter. Analysts project an expansion of 0.4% following the 2.4% growth reported in the last quarter of 2024.
A positive surprise in the GDP data, with a print above 1%, could ease worries about an economic downturn and boost the USD with the initial reaction, causing EUR/USD to turn south. On the other hand, a weaker-than-forecast GDP growth, or a contraction, could feed into expectations for a Federal Reserve (Fed) rate cut in June and weigh on the USD. According to the CME FedWatch Tool, markets are pricing in a nearly 35% probability of the Fed holding the policy rate unchanged in June, suggesting that there is room on the downside for the USD in case the data disappoints.
EUR/USD Technical Analysis
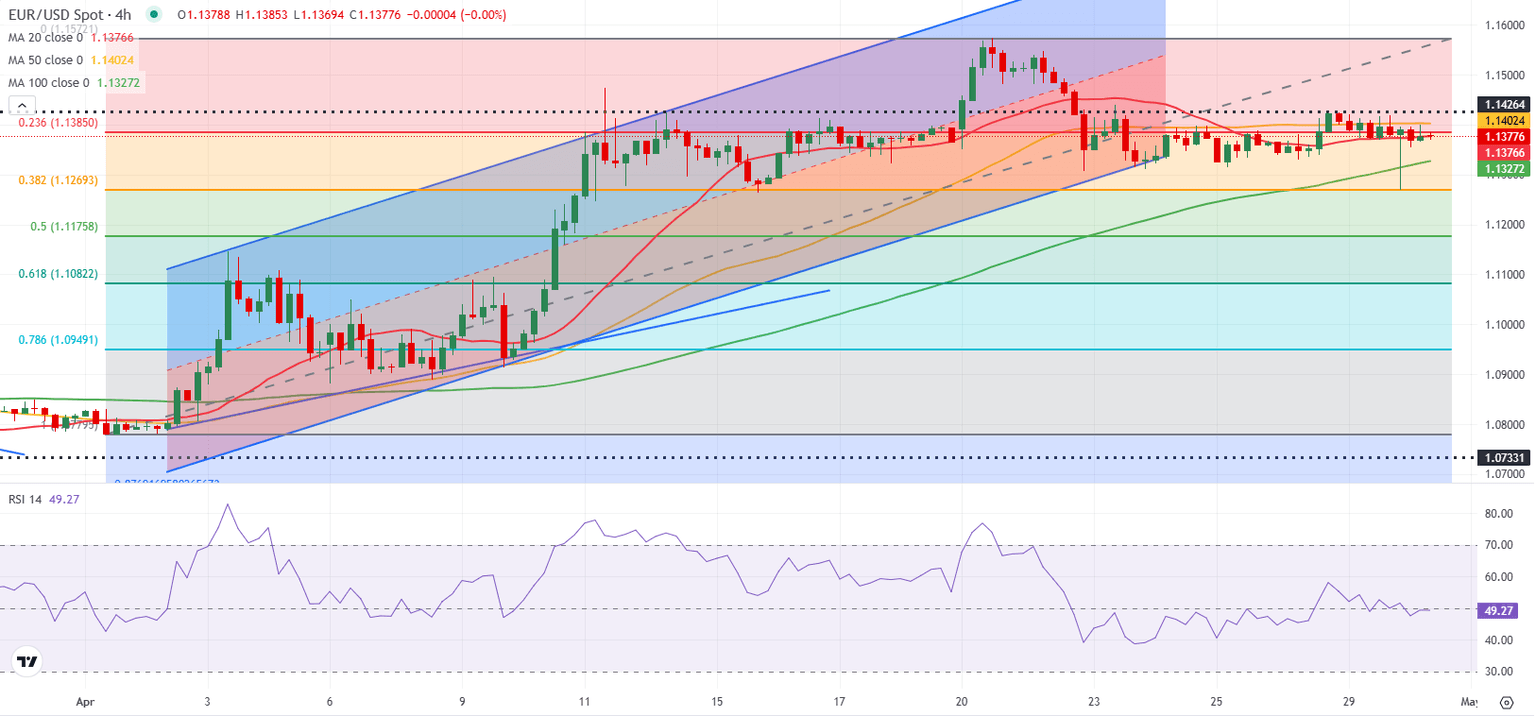
The Relative Strength Index (RSI) indicator on the 4-hour chart stays flat near 50 and EUR/USD continues to fluctuate at around the 20-period and the 50-period Simple Moving Averages, reflecting the pair's indecisiveness.
On the downside, 1.1330 (100-period SMA) aligns as the first support level below before 1.1270 (Fibonacci 38.2% retracement of the latest uptrend) and 1.1175 (Fibonacci 50% retracement). Looking north, resistances could be spotted at 1.1400 (50-period SMA), 1.1430 (static level) and 1.1500 (static level, round level).
GDP FAQs
A country’s Gross Domestic Product (GDP) measures the rate of growth of its economy over a given period of time, usually a quarter. The most reliable figures are those that compare GDP to the previous quarter e.g Q2 of 2023 vs Q1 of 2023, or to the same period in the previous year, e.g Q2 of 2023 vs Q2 of 2022. Annualized quarterly GDP figures extrapolate the growth rate of the quarter as if it were constant for the rest of the year. These can be misleading, however, if temporary shocks impact growth in one quarter but are unlikely to last all year – such as happened in the first quarter of 2020 at the outbreak of the covid pandemic, when growth plummeted.
A higher GDP result is generally positive for a nation’s currency as it reflects a growing economy, which is more likely to produce goods and services that can be exported, as well as attracting higher foreign investment. By the same token, when GDP falls it is usually negative for the currency. When an economy grows people tend to spend more, which leads to inflation. The country’s central bank then has to put up interest rates to combat the inflation with the side effect of attracting more capital inflows from global investors, thus helping the local currency appreciate.
When an economy grows and GDP is rising, people tend to spend more which leads to inflation. The country’s central bank then has to put up interest rates to combat the inflation. Higher interest rates are negative for Gold because they increase the opportunity-cost of holding Gold versus placing the money in a cash deposit account. Therefore, a higher GDP growth rate is usually a bearish factor for Gold price.
Premium
You have reached your limit of 3 free articles for this month.
Start your subscription and get access to all our original articles.
Author

Eren Sengezer
FXStreet
As an economist at heart, Eren Sengezer specializes in the assessment of the short-term and long-term impacts of macroeconomic data, central bank policies and political developments on financial assets.


