EUR/USD Forecast: Dollar’s sell-off triggering a bullish breakout

EUR/USD Current Price: 1.1444
- US inflation met the market’s expectations in December, reaching 7% YoY.
- Wall Street ignored risk-off data and extended Tuesday’s rally.
- EUR/USD is trading at its highest in two months and looking to keep advancing.
The EUR/USD pair trades near a daily high of 1.1445, a level that was last seen on November 15. The American dollar entered a sell-off spiral following the release of US December inflation figures. As expected, the Consumer Price Index came in at 7% YoY, its highest since 1982, although the core reading was upwardly revised to 5.5% for the same period, a sign that inflationary pressures are far from receding.
Nevertheless, speculative interest moved past the headline this time, with stocks rallying and government bond yields retreating further from the multi-month peaks achieved earlier in the week. Hard to explain, unless considering that the Fed has extended its forecast for high inflation at least until the end of the year while pledging to combat it.
Across the pond, Germany published the December Wholesale Price Index, which was up a modest 0.2% MoM, missing the market’s expectations. In the EU, Industrial Production was up 2.3% MoM and down 1.5% YoY.
The EU will not publish relevant data on Thursday, although some European Central Bank policymakers will be on the wire. The US, on the other hand, will publish weekly unemployment claims and the December Producer Price Index, foreseen at 9.8% YoY from 9.6% in November.
EUR/USD short-term technical outlook
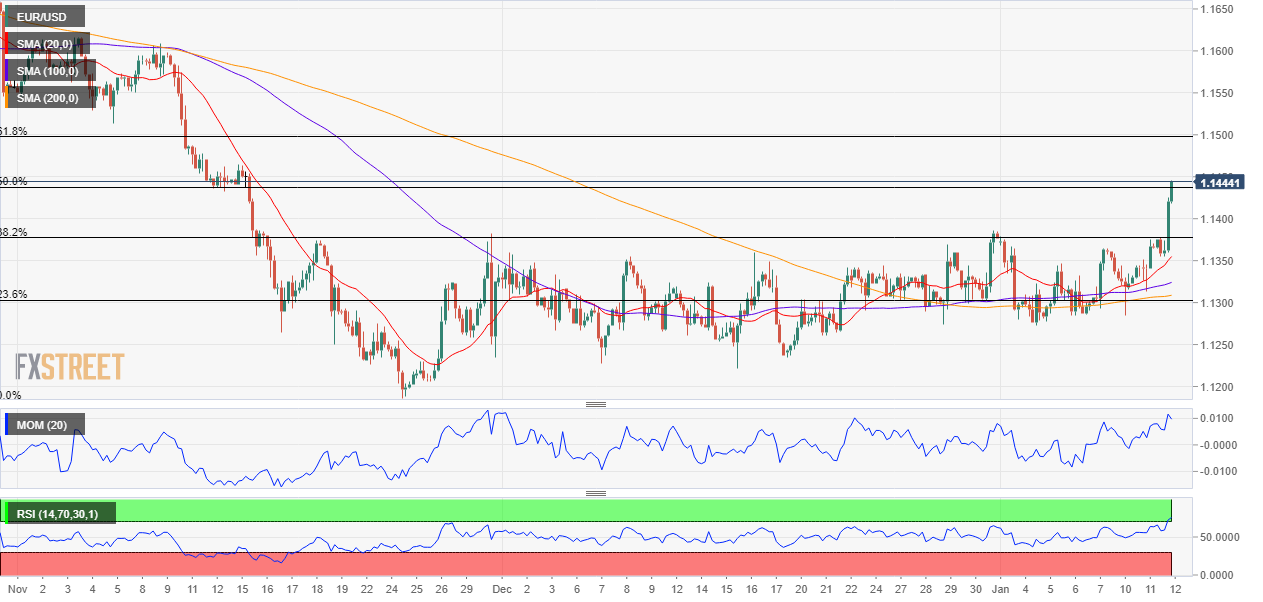
The EUR/USD pair trades around the 50% retracement of its 1.1691/1.1185 decline, approaching a tough long-term static resistance area around 1.1470. The advance has a technical background, as the pair finally stormed the 1.1385 level, the 38.2% retracement of the same decline and a level that rejected bulls multiple times through December.
The daily chart hints at additional gains, as the pair retains daily gains, now well above a mildly bullish 20 SMA, while technical indicators head firmly higher within positive levels. The 100 SMA maintains its bearish slope around the 61.8% retracement of the mentioned slide at 1.1500, a possible bullish target.
The pair reached overbought conditions in the 4-hour chart, accelerating north far above its moving averages. The Momentum indicator keeps heading north despite being in extreme readings, while the RSI has lost strength, consolidating at around 73.
Support levels: 1.1420 1.1385 1.1345
Resistance levels: 1.1470 1.1515 1.1550
Author

Valeria Bednarik
FXStreet
Valeria Bednarik was born and lives in Buenos Aires, Argentina. Her passion for math and numbers pushed her into studying economics in her younger years.


