EUR/USD Forecast: Daily close above 1.1360 could open door for additional gains
- EUR/USD has managed to extend its recovery on Thursday.
- Buyers could target 1.1400 in case 1.1360 resistance fails.
- Dollar remains on the back foot as US T-bond yields edge lower.

EUR/USD has regained its traction after holding above 1.1300 in the early European session and extended its recovery toward 1.1350. In the absence of fundamental catalysts, the modest dollar weakness seems to be helping EUR/USD preserve its bullish momentum.
Following Wednesday's sharp decline, the benchmark 10-year US Treasury bond yield is holding above 1.6% on Thursday, making it difficult for the greenback to find demand. Additionally, the positive shift witnessed in market sentiment doesn't allow the dollar to outperform its risk-sensitive rivals, such as the common currency. S&P Futures were last seen rising 0.25% on a daily basis, suggesting that risk flows are likely to continue to dominate the markets after Wall Street's opening bell.
Earlier in the day, European Central Bank (ECB) policymaker Robert Holzmann argued that quantitative easing has to come to an end with inflation staying high for longer than initially anticipated. Holzmann's hawkish tone seems to be providing an additional boost to the shared currency as well.
The data from the US showed on Thursday that Initial Jobless Claims edged lower to 268,000, coming in slightly worse than market expectation of 260,000. Moreover, the Philadelphia Fed Manufacturing Index improved sharply to 39 in November from 23.8 in October. Nevertheless, the US Dollar Index is continues in negative territory below 96.00 after these releases.
EUR/USD Technical Analysis
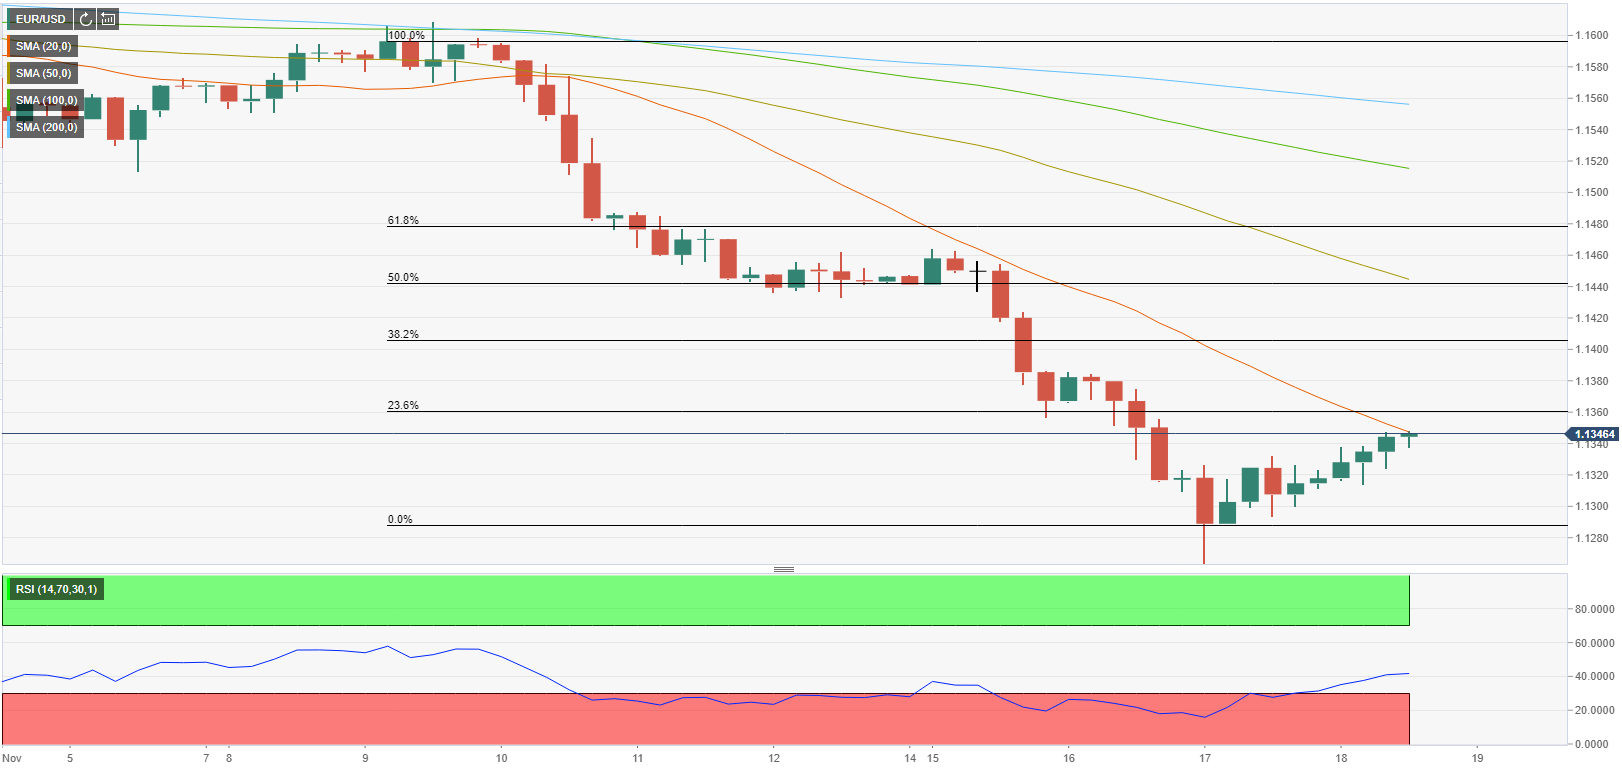
Price is currently being resisted by the 23.6% Fibonacci retracement of the downtrend at 1.1360. If buyers can manage to flip this level into support, the recovery could continue toward the next Fibonacci target at 1.1400. Above that level, the 50-period SMA on the four-hour chart and the Fibonacci 50% retracement forms the next hurdle at 1.1440.
In the meantime, the Relative Strength Index (RSI) indicator is edging higher toward 50, suggesting that sellers remain on the sidelines while waiting for the correction to run its course.
On the downside, supports are located at 1.1300 (psychological level, static level), 1.1260 (16-month low) and 1.1200 (psychological level).
Premium
You have reached your limit of 3 free articles for this month.
Start your subscription and get access to all our original articles.
Author

Eren Sengezer
FXStreet
As an economist at heart, Eren Sengezer specializes in the assessment of the short-term and long-term impacts of macroeconomic data, central bank policies and political developments on financial assets.


