EUR/USD Forecast: Bulls take their chances after US CPI

EUR/USD Current price: 1.0941
- The United States Consumer Price Index rose at an annual pace of 3.2% in February.
- Germany confirmed the February Harmonized Index of Consumer Prices at 2.7% YoY.
- EUR/USD quickly reverted an intraday slide to 1.0902, looks poised to break higher.
The EUR/USD pair recovered some ground throughout the first half of Tuesday after falling to 1.0914 on the first day of the week. Movements across the FX board were restricted amid a scarce macroeconomic calendar and expectations about a United States (US) inflation update.
The tepid US Dollar advance was backed by an uptick in government bond yields, which stand near the lower end of their monthly range, falling short of triggering relevant news. Meanwhile, Germany confirmed the annualized Harmonized Index of Consumer Prices (HCIP) at 2.7%, as previously estimated, while the monthly reading stayed at 0.6%.
Financial markets woke up with the US Consumer Price Index (CPI) release. According to the Bureau of Labor Statistics (BLS), inflation in the US rose at an annual pace of 3.2% in February, higher than the 3.1% expected. The core annual reading was down to 3.8% from 3.9% in January, although above the 3.7% forecast. As a result, US government bond yields ticked higher alongside the USD, although gains were modest and quickly reverted ahead of Wall Street's opening.
EUR/USD short-term technical outlook
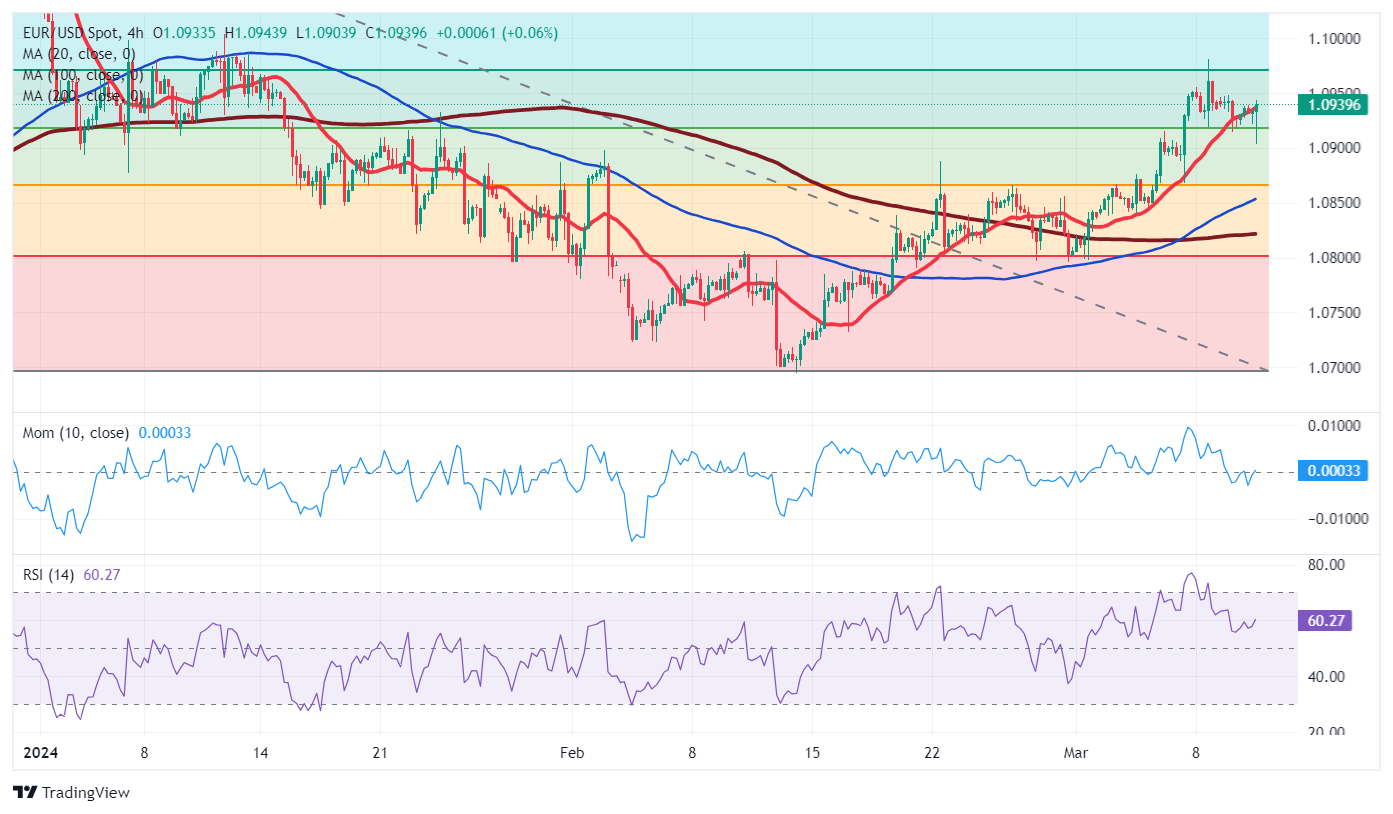
The EUR/USD pair remains confined between Fibonacci levels, but extended its intraday slide to 1.0902. Nevertheless, it trades above the 50% retracement of the 1.1139/1.0734 slide at 1.0917, while the 61.8% retracement provides resistance at 1.0970. From a technical point of view, the risk skews to the upside. In the daily chart, technical indicators are holding within positive levels and picking up after correcting overbought conditions. Furthermore, the pair develops above all its moving averages, with a bullish 20 Simple Moving Average (SMA) crossing above the longer ones, all around the 1.0840/50 area.
The 4-hour chart shows the pair pressuring daily highs and battling to surpass a still bullish 20 SMA. The longer moving averages offer neutral-to-bullish slopes below the shorter one, reflecting buyers' control. Finally, technical indicators are ticking higher, although the Momentum indicator is currently developing within neutral levels, not enough to confirm a new leg north. The pair would need to break through the aforementioned Fibonacci level for bulls to add longs.
Support levels: 1.0915 1.0865 1.0820
Resistance levels: 1.0970 1.1010 1.1045
(This report was corrected on March 12 at 13:35 GMT to say that the US core CPI annual inflation was down to 3.8% in February from 3.9% in January, although above the 3.7% forecast; previously reported as 3.8%.)
Author

Valeria Bednarik
FXStreet
Valeria Bednarik was born and lives in Buenos Aires, Argentina. Her passion for math and numbers pushed her into studying economics in her younger years.
















