EUR/USD Forecast: Bulls dominate the scene but remain in wait-and-see mode

EUR/USD Current Price: 1.0609
- Germany Producer Price Index rose by 28.2% in November, below the 30% anticipated.
- United States housing-related figures disappointed, but optimism prevailed.
- EUR/USD holds above 1.0600, but bulls keep waiting for a catalyst.
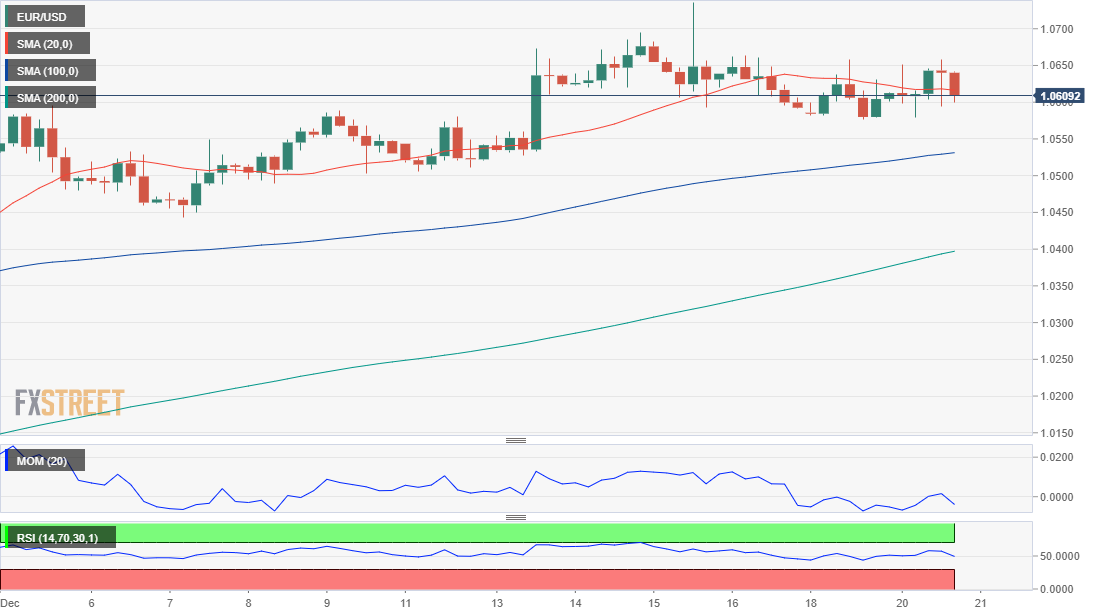
The EUR/USD pair posted a modest advance on Tuesday, up for a second consecutive day, although still ranging just above the 1.0600 threshold. The EUR found support in local macroeconomic data, while the US Dollar fell amid speculation the Bank of Japan will soon abandon its ultra-loose monetary policy and join the tightening train.
During London trading hours, the Euro Area released the October seasonally-adjusted Current Account, which posted a surplus of €-0.4 billion, beating expectations. Furthermore, the German November Producer Price Index rose at an annual pace of 28.2%, easing from the previous 34.5% and below the 30% anticipated by market players. Additionally, EU Consumer Confidence declined by 22.2 in December, improving from the previous -23.9, but worse than the -22 expected. United State data, on the other hand, came in below expected, as Building Permits declined by 11.2T in November, while Housing Starts fell by 0.5%. EUR/USD peaked for the day at 1.0651, unable to surpass the weekly high set on Monday at 1.0657.
On Wednesday, Germany will publish the Gfk Consumer Confidence Survey, expected at -38 in January from -40.2 in the previous month. The United States will release December CB Consumer Confidence, foreseen at 101.0 in December.
EUR/USD short-term technical outlook
The EUR/USD pair hovers around 1.0600, maintaining the bullish potential intact. The daily chart shows that the pair develops above a firmly bullish 20 Simple Moving Average (SMA), which advances above the longer ones and provides dynamic support at around 1.0510. Technical indicators hold within positive levels but lack evident directional strength. The Momentum turned marginally lower, while the Relative Strength Index (RSI) ticks higher at around 64.
The 4-hour chart shows the pair is neutral, seesawing around a mildly bearish 20 SMA, while the longer moving averages maintain bullish slopes below the shorter one. Technical indicators, in the meantime, are stuck around their midlines without directional strength. Still, it is worth adding that buyers continue to defend the downside on slides below the 1.0600 threshold.
Support levels: 1.0580 1.0535 1.0480
Resistance levels: 1.0650 1.0695 1.0740
Author

Valeria Bednarik
FXStreet
Valeria Bednarik was born and lives in Buenos Aires, Argentina. Her passion for math and numbers pushed her into studying economics in her younger years.

















