EUR/USD Current price: 1.0779

  • Most European markets celebrate Easter Monday, maintaining major pairs within tight ranges.
  • After the American opening, the United States will release the March ISM Manufacturing PMI.
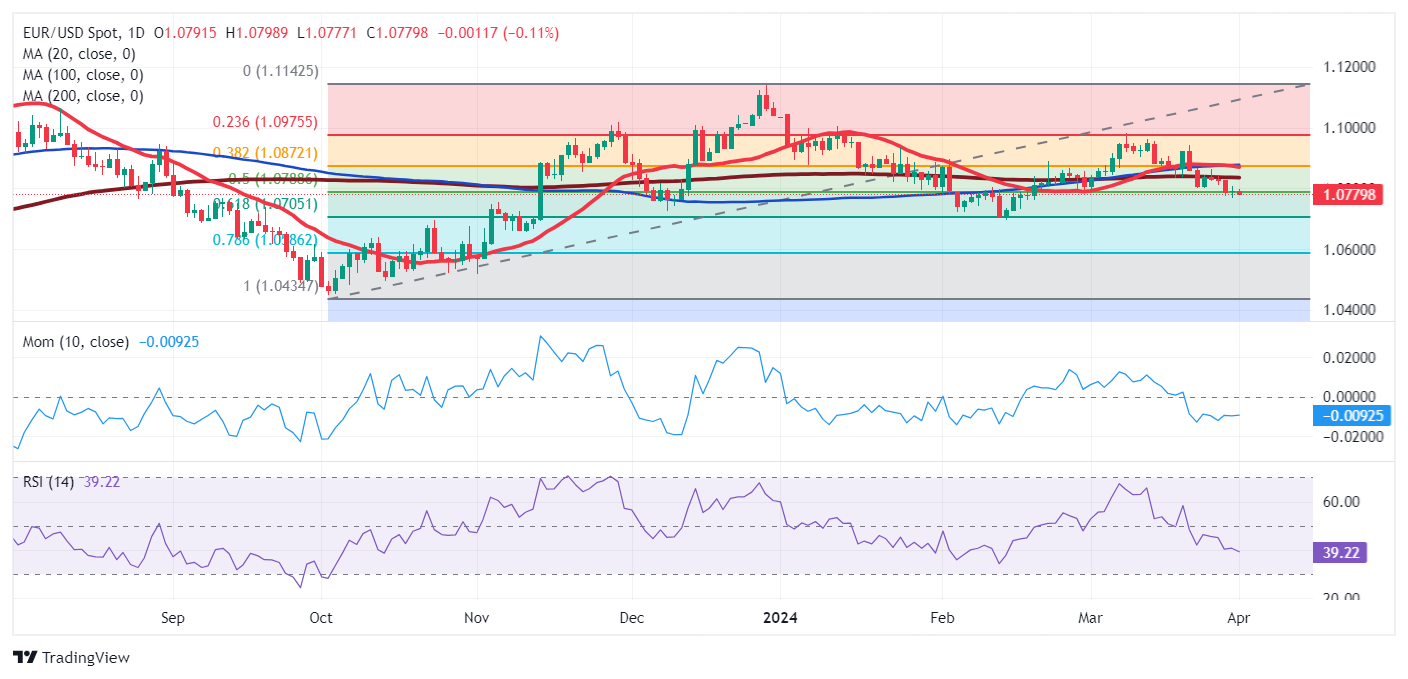
  • EUR/USD nears March low at 1.0767 with a firmer near-term downward tone.

The EUR/USD pair trades uneventfully in a holiday-thinned session, hovering around the 1.0780 level. Most Asian and European markets were closed on Easter Monday. In Canada, the holiday is observed in some provinces, while the United States (US) does not celebrate the date, meaning activity should become more interesting in the American session.

Stocks traded mixed in Asia, with the Japanese Nikkei 225 plummeting after the country published the Q1 Tankan report. This report indicated a sharp decline in business sentiment as the outlook contracted for manufacturers and service providers. On the contrary, Chinese stocks advanced following the release of the March Caixin Manufacturing PMI, which improved more than anticipated to 51.1 from 50.9 in February.

The upcoming session will bring the official US ISM Manufacturing PMI, foreseen in March at 48.4, better than the previous 47.8. S&P Global will release the final estimate of the Manufacturing PMI for the same month, previously at 52.5.

EUR/USD short-term technical outlook

The EUR/USD pair is confined to a 20 pips range below 1.0803, the 61.8% Fibonacci retracement of the 1.0694/1.0981 rally, suggesting bears retain control. Technical readings in the daily chart support a downward extension as technical indicators grind lower within negative levels. Indicators lack bearish momentum amid the absence of volume. Meanwhile, EUR/USD extends its slide below all its moving averages, which stand directionless. The 200 Simple Moving Average (SMA) converges with the 50% retracement of the mentioned rally at around 1.0840, reinforcing the resistance level.

The near-term bearish potential is firmer. The 4-hour chart shows the 20 SMA accelerated south above the current level while below the longer ones. At the same time, technical indicators gain downward traction within negative levels, supporting another leg lower on a break below Friday’s low at 1.0767.

Support levels: 1.0765 1.0720 1.0680

Resistance levels: 1.0805 1.0840 1.0875  

Information on these pages contains forward-looking statements that involve risks and uncertainties. Markets and instruments profiled on this page are for informational purposes only and should not in any way come across as a recommendation to buy or sell in these assets. You should do your own thorough research before making any investment decisions. FXStreet does not in any way guarantee that this information is free from mistakes, errors, or material misstatements. It also does not guarantee that this information is of a timely nature. Investing in Open Markets involves a great deal of risk, including the loss of all or a portion of your investment, as well as emotional distress. All risks, losses and costs associated with investing, including total loss of principal, are your responsibility. The views and opinions expressed in this article are those of the authors and do not necessarily reflect the official policy or position of FXStreet nor its advertisers. The author will not be held responsible for information that is found at the end of links posted on this page.

If not otherwise explicitly mentioned in the body of the article, at the time of writing, the author has no position in any stock mentioned in this article and no business relationship with any company mentioned. The author has not received compensation for writing this article, other than from FXStreet.

FXStreet and the author do not provide personalized recommendations. The author makes no representations as to the accuracy, completeness, or suitability of this information. FXStreet and the author will not be liable for any errors, omissions or any losses, injuries or damages arising from this information and its display or use. Errors and omissions excepted.

The author and FXStreet are not registered investment advisors and nothing in this article is intended to be investment advice.

Recommended Content


Recommended Content

Editors’ Picks

NZD/USD holds strong gains near 0.6150 as RBNZ Orr's speaks

NZD/USD holds strong gains near 0.6150 as RBNZ Orr's speaks

NZD/USD is consolidating the rally near the 0.6150 level after the RBNZ held the interest rate at 5.50% but upgraded its peak OCR forecast from 5.60% to 5.61% in September 2024, implying chances of another 25 bps hike in the offing. Governor Orr's presser is underway. 

NZD/USD News

AUD/USD edges higher toward 0.6700, tracking Kiwi's RBNZ-led rally

AUD/USD edges higher toward 0.6700, tracking Kiwi's RBNZ-led rally

AUD/USD is edging higher toward 0.6700 in Asian trading on Wednesday, picking up fresh bids in tandem with the NZD/USD pair. The Kiwi rallies on the hawkish RBNZ hold decision. Renewed US Dollar weakness also supports the pair ahead of the Fed Minutes. 

AUD/USD News

Gold price clings to mild losses ahead of FOMC Minutes

Gold price clings to mild losses ahead of FOMC Minutes

Gold price trades on a negative note on Wednesday after retreating from a record high on Monday. Members of the Federal Reserve warned that the US central bank needed much more convincing that inflation was easing before it could begin cutting interest rates, emphasizing the Fed is likely to keep rates higher for longer.

Gold News

DeFi and Layer 2 coins rally following Ethereum's rise

DeFi and Layer 2 coins rally following Ethereum's rise

Ethereum ecosystem tokens have surged following ETH's recent rally after optimism that the Securities & Exchange Commission would approve spot ETH ETFs.

Read more

Ready for NVDA

Ready for NVDA

S&P 500 saw upswing rejected, making it remain in a tight range – but the sellers aren‘t in control. Nasdaq had one of its days of outperformance, with select names sending signals as to what to expect from NVDA earnings, already now.

Read more

Majors

Cryptocurrencies

Signatures