EUR/USD Elliott Wave technical analysis [Video]
![EUR/USD Elliott Wave technical analysis [Video]](https://editorial.fxsstatic.com/images/i/EURUSD-bearish-object_XtraLarge.png)
EUR/USD Elliott Wave technical analysis
-
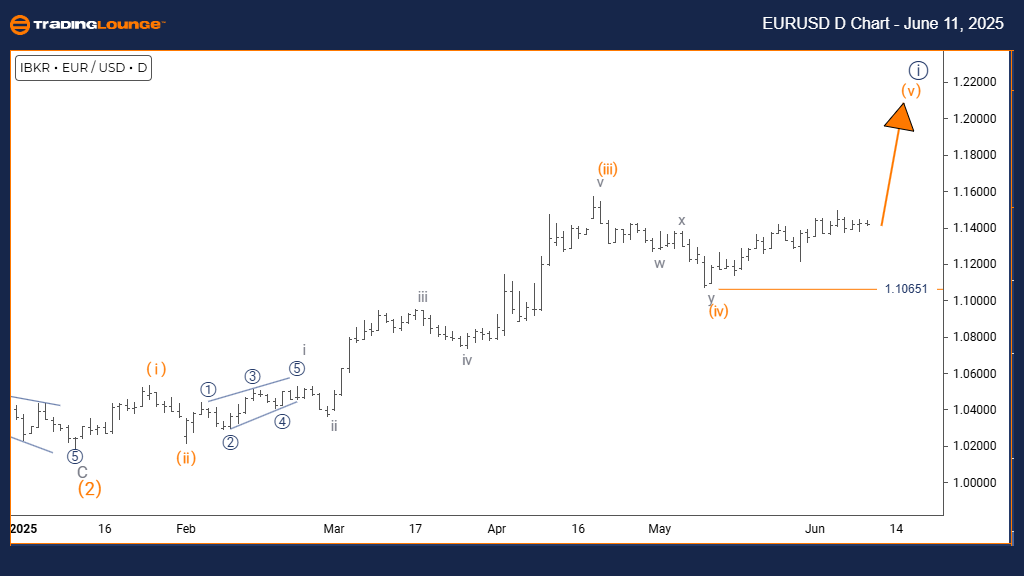
Function: Bullish Trend.
-
Mode: Impulsive.
-
Structure: Orange Wave 5.
-
Position: Navy Blue Wave 1.
-
Direction next higher degrees: Orange Wave 5 (Started).
-
Details: Orange Wave 4 appears completed, and Orange Wave 5 is in play.
-
Wave cancel invalid level: 1.10651.
The EURUSD daily chart Elliott Wave analysis reflects a bullish outlook, with price action currently in an impulsive phase, indicating strong upward momentum. The active wave structure is Orange Wave 5, which forms part of a broader bullish sequence—specifically Navy Blue Wave 1. This placement signals that the currency pair may be approaching the end of an impulsive advance.
Orange Wave 4 seems to have concluded its corrective cycle, setting the stage for Orange Wave 5 to drive the final leg of the upward move. This wave often delivers strong price action as it completes the five-wave sequence. The next higher degree to observe is the ongoing Orange Wave 5.
Key to this analysis is the invalidation level at 1.10651. A move below this threshold would nullify the current wave count, requiring reevaluation. As long as the price remains above this level, the bullish structure remains intact. The impulsive nature of Orange Wave 5 suggests continued upward potential, though traders should be alert for signs of exhaustion as this wave marks the final stage of the larger Navy Blue Wave 1 structure.
EUR/USD Elliott Wave technical analysis
-
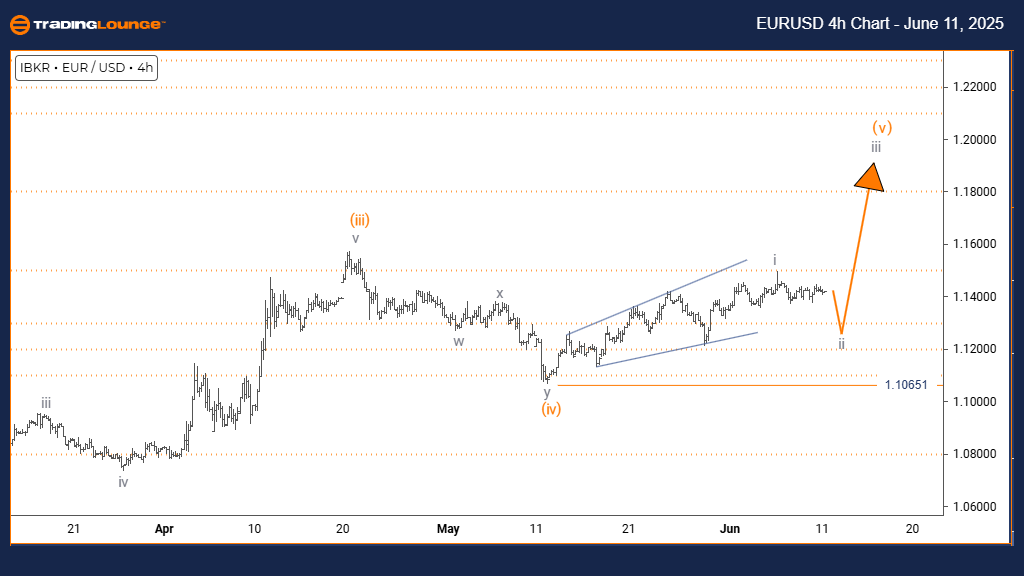
Function: Counter Trend.
-
Mode: Corrective.
-
Structure: Gray Wave 2.
-
Position: Orange Wave 5.
-
Direction next higher degrees: Gray Wave 3.
-
Details: Gray Wave 1 appears completed, and Gray Wave 2 is now unfolding.
-
Wave cancel invalid level: 1.10651.
The EURUSD 4-hour chart Elliott Wave analysis suggests a counter-trend scenario characterized by corrective movement. Price action is within Gray Wave 2, a retracement phase inside the larger structure of Orange Wave 5. This positioning indicates a short-term pause in bullish momentum while the overall trend remains intact.
Gray Wave 1 appears to have completed, with the market now navigating through Gray Wave 2. This wave typically results in range-bound or corrective price behavior, signaling temporary market consolidation before a potential resumption of the bullish trend through Gray Wave 3.
The current technical context shows that EURUSD remains in a corrective pattern, and traders should closely observe for signs of Gray Wave 2 nearing completion. Once finalized, Gray Wave 3 is expected to initiate a fresh upward move in line with the broader trend of Orange Wave 5. The invalidation level at 1.10651 remains critical for maintaining the current wave count.
EUR/USD Elliott Wave technical analysis [Video]
Author

Peter Mathers
TradingLounge
Peter Mathers started actively trading in 1982. He began his career at Hoei and Shoin, a Japanese futures trading company.


