EUR/USD Elliott Wave technical analysis [Video]
![EUR/USD Elliott Wave technical analysis [Video]](https://editorial.fxsstatic.com/images/i/eur-usd-002_XtraLarge.jpg)
EUR/USD Elliott Wave technical analysis
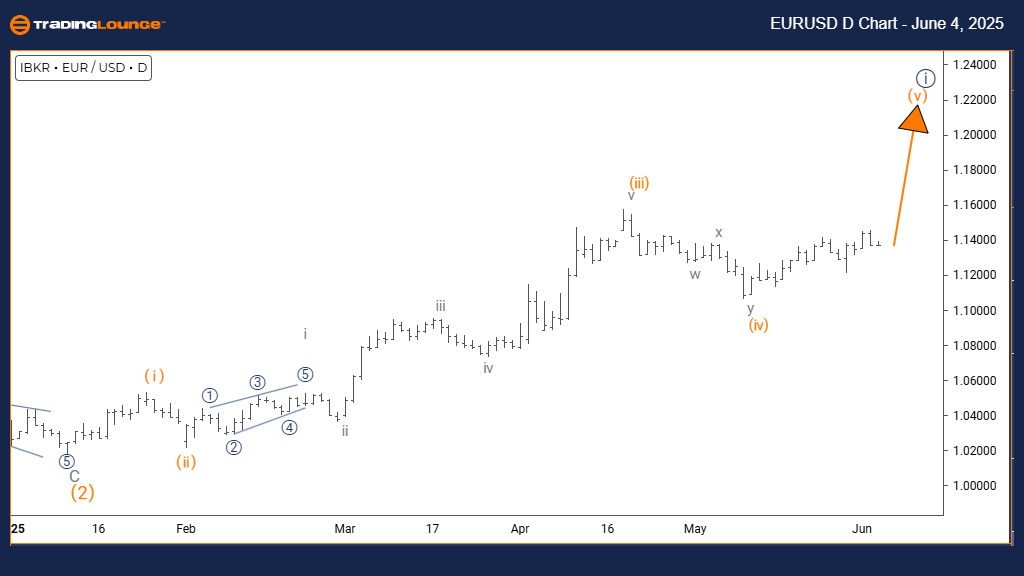
Function: Bullish Trend.
Mode: Impulsive.
Structure: Orange wave 5.
Position: Navy blue wave 1.
Direction next higher degrees: Orange wave 5 (in progress).
Details: Orange wave 4 appears completed; orange wave 5 is currently unfolding.
The 4-hour chart analysis identifies EURUSD as being in a corrective counter-trend phase within a broader market trend. The technical pattern highlights gray wave two forming inside a larger bearish structure, namely orange wave five. This suggests that gray wave one has finalized its downward movement, followed by a temporary retracement phase in wave two. Such setups usually reflect a brief interruption in the trend, potentially followed by further bearish momentum.
Gray wave one is now complete, initiating a corrective bounce in gray wave two. This phase signals limited upward potential, as the structure continues to favor a bearish continuation into gray wave three, unless major resistance levels are breached. This technical outlook helps forex traders understand EURUSD’s placement in a larger corrective wave sequence.
As this corrective phase progresses, additional market volatility is likely. Wave two acts as a temporary stall in the overall downward trend. Traders should closely monitor for signs that wave two has ended, which would suggest the start of wave three's descent. This analysis provides insight into the short-term opportunity while highlighting the probable bearish continuation.
Traders are advised to watch for developing patterns that may offer better clarity on direction, while also practicing cautious position management due to the ambiguous wave interpretation. The present rise is seen as part of a corrective setup, not a new bullish trend, and the potential remains for renewed downward pressure after this correction phase completes.
EUR/USD Elliott Wave technical analysis
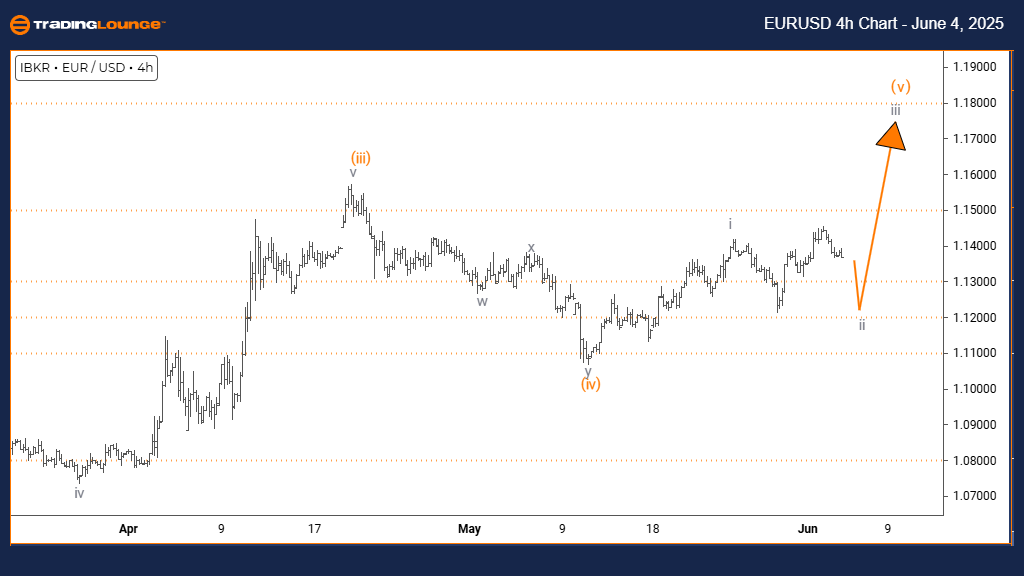
Function: Counter Trend.
Mode: Corrective.
Structure: Gray wave 2.
Position: Orange wave 5.
Direction next higher degrees: Gray wave 3.
Details: Gray wave 1 appears complete; gray wave 2 is currently developing.
The 4-hour chart analysis shows EURUSD in a counter-trend corrective movement within its broader bearish structure. The current setup indicates gray wave two is forming as part of a larger orange wave five decline. This implies gray wave one has concluded, and EURUSD has now entered a short-term retracement. Typically, this pattern reflects a pause in trend direction before resuming bearish momentum.
According to the wave count, gray wave one has ended and gray wave two has initiated a corrective rally. This phase is likely to offer limited upward potential, with the overall pattern favoring a downtrend continuation into gray wave three. Unless critical resistance zones are surpassed, the prevailing structure signals further weakness ahead. This analysis provides essential perspective on EURUSD's place within the corrective wave cycle.
The wave structure suggests more volatility could emerge as gray wave two unfolds. This wave acts as a temporary break within the larger decline. Traders should watch for signals of wave two's completion, which would likely trigger the start of gray wave three’s downward movement. This context helps identify both the current counter-trend window and the expected bearish follow-through.
Forex traders should stay alert to technical patterns that may better forecast market direction while adhering to risk-managed position sizing due to the uncertain nature of wave structures. The current rise appears to be part of a broader correction—not a trend reversal—suggesting further downside pressure could resume once this corrective move finalizes.
EUR/USD Elliott Wave technical analysis [Video]
Author

Peter Mathers
TradingLounge
Peter Mathers started actively trading in 1982. He began his career at Hoei and Shoin, a Japanese futures trading company.


