EUR/USD Elliott Wave technical analysis [Video]
![EUR/USD Elliott Wave technical analysis [Video]](https://editorial.fxsstatic.com/images/i/EURUSD-bullish-chart_XtraLarge.png)
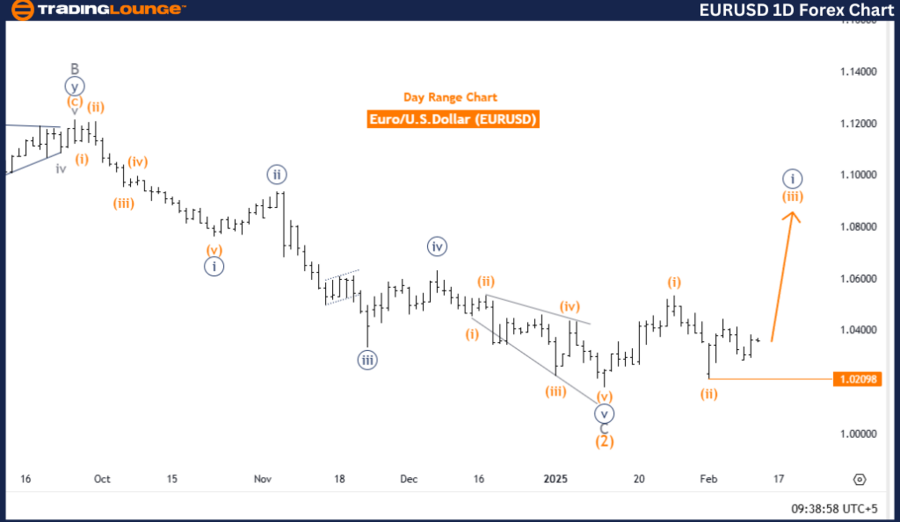
Euro/U.S. Dollar (EURUSD) day chart.
EUR/USD Elliott Wave technical analysis
-
Function: Bullish Trend.
-
Mode: Impulsive.
-
Structure: Orange Wave 3.
-
Position: Navy Blue Wave 3.
-
Direction next higher degrees: Orange Wave 3 (Started).
-
Details: Orange Wave 2 of 3 appears completed; Orange Wave 3 is now in play.
-
Wave cancel invalidation level: 1.02098.
Market overview
The EURUSD day chart presents a bullish trend with an impulsive wave structure. The ongoing wave in focus is Orange Wave 3, which is part of a broader Navy Blue Wave 3, suggesting strong upward market momentum.
Orange Wave 2, a corrective phase, appears to have ended, paving the way for Orange Wave 3 to unfold. The completion of this corrective wave signals that the market is now moving higher, with Orange Wave 3 expected to be a strong impulsive move. This phase typically marks accelerated price movement, showcasing the trend's strength.
The presence of Navy Blue Wave 3 reinforces the bullish outlook, further supporting expectations for continued upward movement. With Orange Wave 3 in play, the market is in an impulsive phase, characterized by rapid price increases.
Key level to watch
A crucial level to monitor is the wave cancel invalidation level at 1.02098. If breached, it would invalidate the current wave count. However, as long as the price remains above this level, the ongoing bullish trend remains valid and intact.
Conclusion
The EURUSD day chart reflects a bullish trend with an impulsive wave structure, currently positioned in Orange Wave 3 within Navy Blue Wave 3. The market is expected to continue rising as Orange Wave 3 develops.
Traders should monitor price movements above 1.02098 to confirm trend strength and adjust their strategies accordingly.
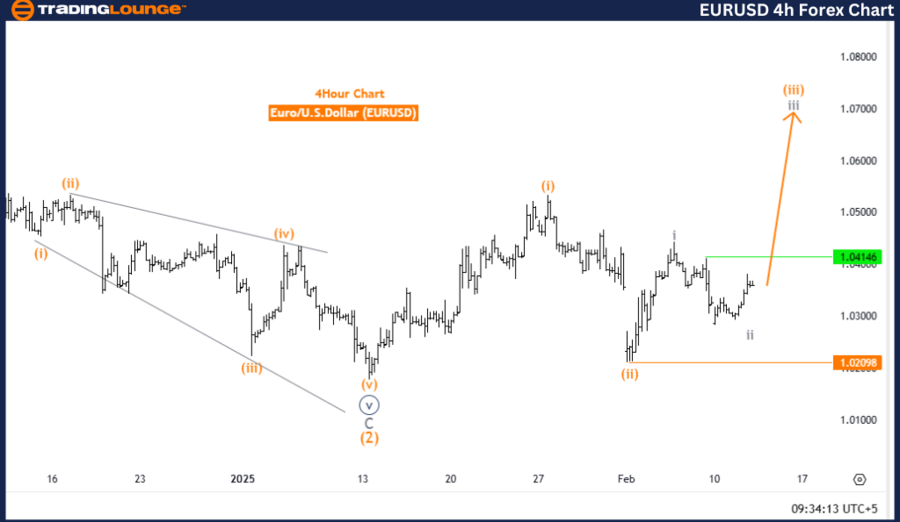
Euro/U.S. Dollar (EURUSD) four-hour chart.
EUR/USD Elliott Wave technical analysis
-
Function: Bullish Trend.
-
Mode: Impulsive.
-
Structure: Gray Wave 3.
-
Position: Orange Wave 3.
-
Direction next higher degrees: Gray Wave 3 (Started).
-
Details: Gray Wave 2 of Orange Wave 3 appears completed; Gray Wave 3 is now in play.
-
Wave cancel invalidation level: 1.02098.
Market overview
The EURUSD 4-hour chart confirms a bullish trend based on Elliott Wave analysis, with an impulsive wave structure. The current market position is within Orange Wave 3, which is a component of a larger Gray Wave 3, indicating ongoing upward momentum.
With Gray Wave 2 completed, the market has concluded its corrective phase and is now advancing into Gray Wave 3 of Orange Wave 3. This wave represents a strong price movement in the trend’s direction, reinforcing bullish expectations. The impulsive structure highlights that buyers remain in control, driving prices higher.
Key factors to watch
As Gray Wave 3 progresses, traders should anticipate further bullish movement, with potential price gains. This phase is typically marked by sharp upward moves, making it an important trading opportunity.
A crucial level to monitor is the wave cancel invalidation level at 1.02098. A break below this point would indicate an incorrect wave count, requiring market structure reassessment. Remaining above this level supports the bullish outlook and confirms the trend’s strength.
Conclusion
The EURUSD 4-hour chart showcases a strong bullish trend within an impulsive wave structure. The completion of Gray Wave 2 supports the continuation of Gray Wave 3 within Orange Wave 3, signaling further upward movement.
Traders should monitor sustained price increases while keeping an eye on the invalidation level (1.02098) to ensure accurate market analysis and strategic decision-making.
EUR/USD Elliott Wave technical analysis [Video]
Author

Peter Mathers
TradingLounge
Peter Mathers started actively trading in 1982. He began his career at Hoei and Shoin, a Japanese futures trading company.


