EUR/USD Elliott Wave technical analysis [Video]
![EUR/USD Elliott Wave technical analysis [Video]](https://editorial.fxstreet.com/images/Markets/Currencies/Majors/EURUSD/world-currencies-53475296_XtraLarge.jpg)
EUR/USD Elliott Wave Analysis Trading Lounge.
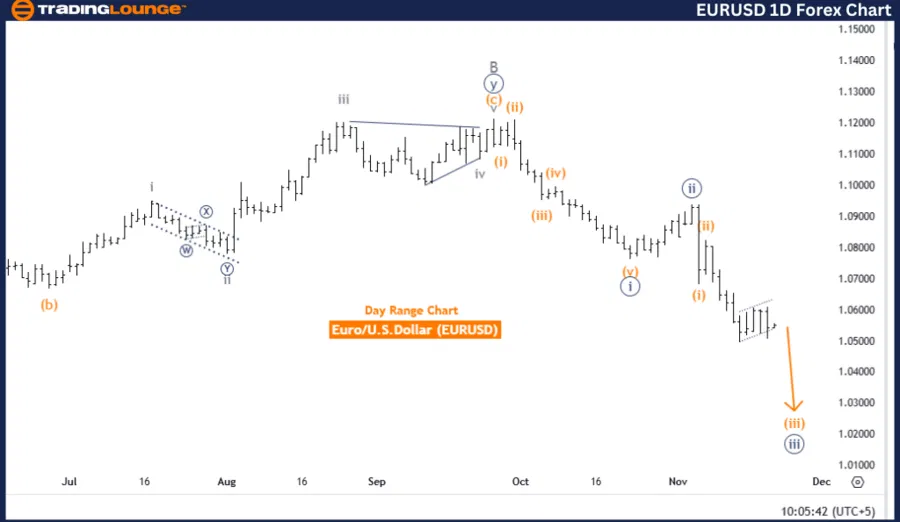
Euro/U.S. Dollar (EURUSD) Day Chart.
EUR/USD Elliott Wave technical analysis
-
Function: Counter Trend.
-
Mode: Impulsive.
-
Structure: Orange wave 3.
-
Position: Navy blue wave 3.
-
Direction (next higher degrees): Orange wave 4.
-
Details: Orange wave 2 appears completed; orange wave 3 is now unfolding.
-
Wave cancel invalid level: 1.08263.
The EURUSD daily chart showcases a counter-trend movement analyzed through the Elliott Wave framework. The ongoing structure is currently in the impulsive phase, with orange wave 3 actively progressing. This follows the presumed completion of orange wave 2, indicating further development within the wave sequence.
The current position within the impulsive wave is navy blue wave 3, which forms a segment of the larger orange wave 3. This phase is characterized by downward momentum within the counter-trend, suggesting the potential for additional price declines. As the wave structure evolves, the emergence of orange wave 4, a higher-degree corrective wave, is anticipated as the next significant phase.
An invalidation level has been set at 1.08263. If the market surpasses this level, the existing wave count and analysis will no longer be valid, necessitating a reassessment of the wave structure and market trend direction.
In conclusion, the EURUSD daily chart outlines a counter-trend movement led by orange wave 3, with navy blue wave 3 driving the present market trajectory. Monitoring the invalidation level of 1.08263 is essential, as a breach would invalidate the current analysis. This framework provides a detailed understanding of the counter-trend dynamics and valuable guidance for traders navigating potential market movements.
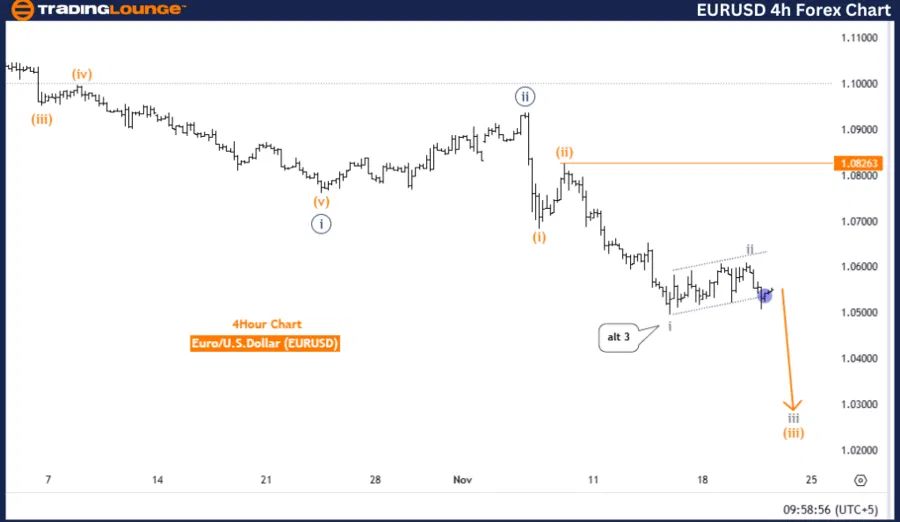
EUR/USD four-hour chart.
EUR/USD Elliott Wave technical analysis
-
Function: Bearish Trend.
-
Mode: Impulsive.
-
Structure: Gray wave 3.
-
Position: Orange wave 3.
-
Direction (next higher degrees): Gray wave 4.
-
Details: Gray wave 2 appears completed; gray wave 3 is now in play.
-
Wave cancel invalid level: 1.08263.
The EURUSD 4-hour chart reflects a bearish trend underpinned by Elliott Wave analysis. The current phase is impulsive, with gray wave 3 actively unfolding. This progression follows the apparent completion of gray wave 2, indicating sustained downward momentum.
Within the structure, the active position is orange wave 3, forming part of the broader gray wave 3. This segment is significant, as it represents an extension of the prevailing bearish trend, pushing the market lower. Upon the completion of gray wave 3, the Elliott Wave model anticipates a corrective phase with the emergence of gray wave 4.
An invalidation level is set at 1.08263. If the market moves above this threshold, the current wave count would no longer apply, requiring a reevaluation of the wave structure and its implications for future price movements.
In summary, the EURUSD 4-hour chart highlights a bearish phase dominated by gray wave 3, with orange wave 3 driving the downward trend. Monitoring the invalidation level of 1.08263 remains critical, as breaching this level would negate the current analysis. This Elliott Wave interpretation offers traders a framework to understand the ongoing bearish trend and prepare for potential market shifts.
EUR/USD Elliott Wave technical analysis [Video]
Author

Peter Mathers
TradingLounge
Peter Mathers started actively trading in 1982. He began his career at Hoei and Shoin, a Japanese futures trading company.


