EUR/USD Elliott Wave technical analysis [Video]
![EUR/USD Elliott Wave technical analysis [Video]](https://editorial.fxstreet.com/images/Markets/Currencies/Majors/EURUSD/euro-or-dollar-3353142_XtraLarge.jpg)
EUR/USD Elliott Wave technical analysis
Function: Trend.
Mode: Impulsive.
Structure: Orange wave 3.
Position: Navy blue wave 3.
Direction next lower degrees: Orange wave 4.
Details: Orange wave 2 looking completed, now orange wave 3 is in play. Wave cancel invalid level: 1.07780.
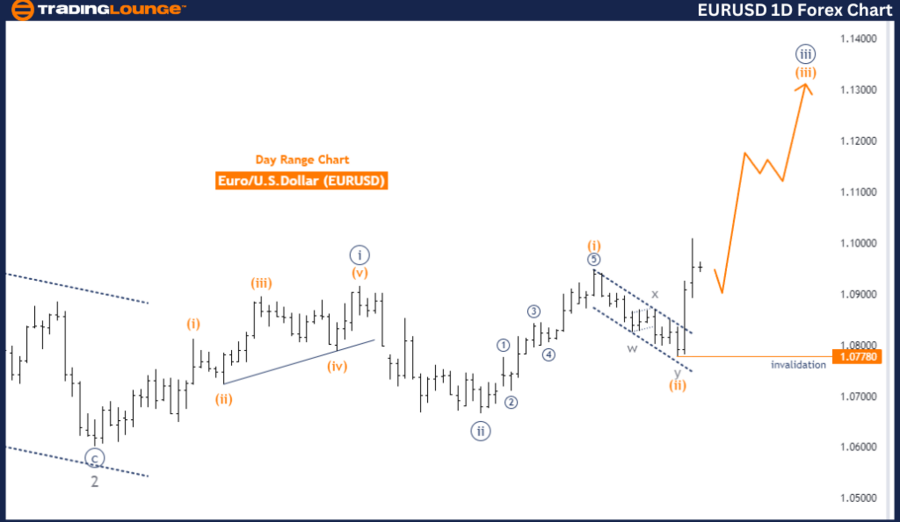
The EURUSD Elliott Wave Analysis for the daily chart reveals a trending market in an impulsive mode. The primary wave structure identified is orange wave 3, indicating a strong continuation of the trend. Currently, the market is positioned in navy blue wave 3 within this impulsive structure, suggesting that the trend is gaining momentum.
The analysis specifies that orange wave 2 appears to be completed. This implies that the corrective phase has ended, and now the market is advancing in orange wave 3. The completion of orange wave 2 typically signals the start of a significant upward move, as wave 3 in Elliott Wave theory is often the most powerful and extended wave in the impulsive sequence.
Navy blue wave 3 is the current position within this structure, indicating that the market is in the midst of a robust upward trend. This wave is part of the larger orange wave 3, highlighting a multi-degree alignment of bullish momentum. As the market progresses through navy blue wave 3, the next phase to watch for would be the development of orange wave 4, which will represent the next corrective phase within the ongoing trend.
The wave cancel invalid level is set at 1.07780. This level is crucial as it serves as a validation point for the current wave structure. If the EURUSD pair falls below this level, it would invalidate the existing wave count, signaling that the anticipated impulsive wave is no longer valid. This would necessitate a reevaluation of the market’s direction and wave structure.
In summary, the EURUSD Elliott Wave Analysis on the daily chart indicates a trending market in an impulsive mode, with the market currently in navy blue wave 3 of the larger orange wave 3. The completion of orange wave 2 suggests the beginning of a significant upward move. The wave cancel invalid level of 1.07780 is crucial for maintaining the validity of the current wave structure, and any breach of this level would require a reassessment of the wave count.
EUR/USD day chart
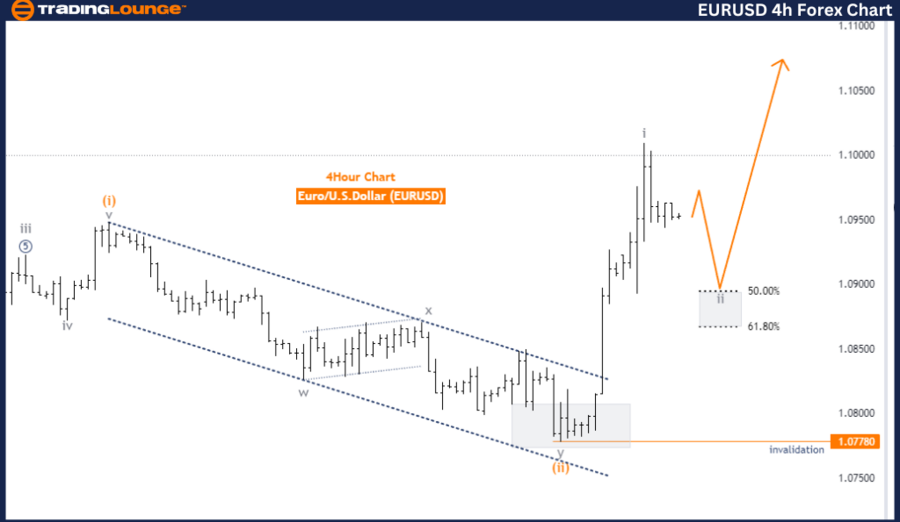
EUR/USD four-hour chart
Function: Counter Trend.
Mode: CorrectiveStructure: Gray wave 2.
Position: Orange wave 3.
Direction next higher degrees: Gray wave 3.
Details: Gray wave 1 looking completed, now gray wave 2 is in play. Wave cancel invalid level: 1.07780
The EURUSD Elliott Wave Analysis for the 4-hour chart indicates a counter-trend movement in a corrective mode. The primary wave structure identified is gray wave 2, which signals a retracement within the broader trend. The current position within this structure is orange wave 3, suggesting a potential upward correction within the larger gray wave 2.
Gray wave 1 is noted as being completed, implying that the initial phase of the downward trend has finished. Now, gray wave 2 is in play, indicating a corrective phase that typically retraces a portion of the decline seen in gray wave 1. This phase is crucial for determining the next significant move in the market, as it provides insight into the strength and sustainability of the larger trend.
The analysis indicates that gray wave 2 is unfolding, which usually consists of three sub-waves (A, B, and C) in a corrective pattern. The orange wave 3 within this structure is currently developing, suggesting that the market is experiencing a temporary rally or retracement against the main trend. This phase could see the price move higher before the next downward wave (gray wave 3) begins.
The wave cancel invalid level is set at 1.07780, which is a critical threshold for maintaining the validity of the current wave structure. If the EURUSD pair rises above this level, it would invalidate the existing wave count, indicating that the expected corrective pattern is no longer applicable. In such a scenario, a reevaluation of the market’s direction and wave structure would be necessary.
In summary, the EURUSD Elliott Wave Analysis on the 4-hour chart suggests a counter-trend movement in a corrective mode, with the market currently in gray wave 2. The completion of gray wave 1 indicates a potential temporary rally within the broader downward trend. The wave cancel invalid level of 1.07780 is crucial for validating the current wave structure, and any breach of this level would require a reassessment of the wave count.
EUR/USD Elliott Wave technical analysis [Video]
Author

Peter Mathers
TradingLounge
Peter Mathers started actively trading in 1982. He began his career at Hoei and Shoin, a Japanese futures trading company.


