|

EUR/USD Elliott Wave impulsive decline unfolding [Video]

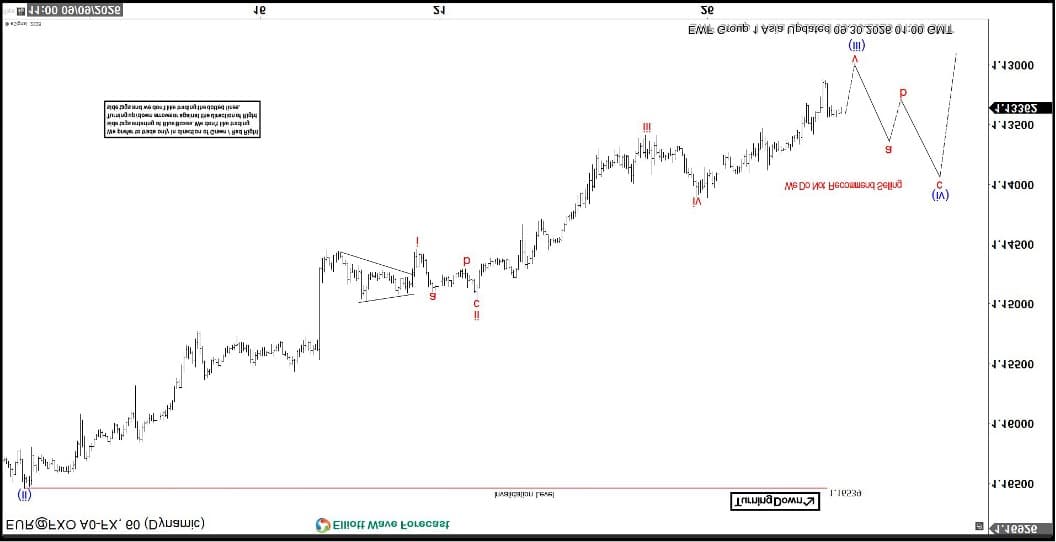
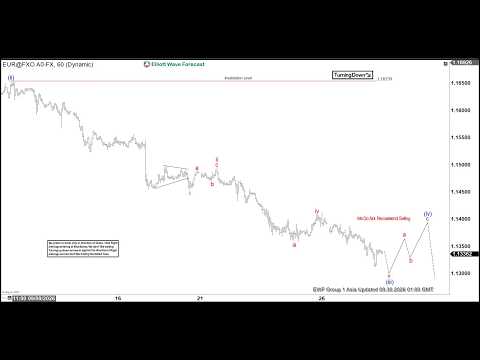
The short‑term Elliott Wave outlook for EURUSD indicates that a five‑wave impulsive structure is developing from the August 21, 2026 high. From that peak, wave (i) concluded at 1.1566, followed by a corrective rally in wave (ii) that terminated at 1.1654. The pair then resumed its decline in wave (iii), which is unfolding with internal subdivision into another five‑wave sequence of lesser degree. Within this sequence, wave i ended at 1.145, while wave ii retraced modestly to 1.1495.

The market continued lower in wave iii, reaching 1.1359, before a brief rally in wave iv that ended at 1.141. Current price action suggests that wave v of (iii) is nearing completion. Once this segment concludes, EURUSD should enter a corrective bounce in wave (iv), which will provide temporary relief before the broader decline resumes. In the near term, as long as the pivot at 1.1654 remains intact, rallies are expected to fail within corrective formations of three or seven swings. This reinforces the bearish outlook and signals that further downside remains likely.

EUR/USD 60 minute Elliott Wave chart
EUR/USD Elliott Wave [Video]
Youtube preview

Author

Elliott Wave Forecast Team

Elliott Wave Forecast Team

ElliottWave-Forecast.com

More from Elliott Wave Forecast Team
Share:

Editor's Picks

AUD/USD renews two-month lows near 0.6950 after Australian CPI data

AUD/USD is renewing two-month lows near 0.6950 in the Asian session on Wednesday, as below-expectations August Australian underlying CPI data pours cold water on expectations for further RBA interest rate hikes. Chinese PMI data also fail to inspire the Australian Dollar, despite a pause in the US Dollar advance.

USD/JPY drops below 157.00 as intervention risks counter Japan's weak data

USD/JPY keeps losses below 157.00 in the Asian session on Wednesday, as hawkish BoJ expectations, along with intervention risks, underpin the Japanese Yen, countering dismal domestic factory output and retail sales data. Meanwhile, a broad US Dollar retreat also collaborates to the pair's downside.

Gold consolidates below $4,200, looks to US ADP and PCE

Gold struggles to capitalize on the previous day's recovery from an eight-week low, consolidating below $4,200 in the Asian session on Wednesday. The overnight slide in oil prices eased the US Treasury bond rout, supporting the bullion. However, Fed rate-hike bets and inflationary concerns keep bond yields near multi-year highs. Moreover, geopolitical uncertainties underpin the safe-haven US Dollar, which, in turn, limits bullion.

Ethereum sees profit-taking near $2,700 ahead of key US economic data
Ethereum (ETH) has shown signs of profit-taking near $2,700 over the past few days, with rising exchange deposits and a slowdown in exchange-traded fund (ETF) inflows ahead of US inflation and labor market data releases. The top altcoin's Exchange Reserves, which track the total amount of a crypto asset held across exchange wallets, have increased by roughly 125K ETH since Friday.
Silver is more volatile than Gold ahead of PCE and NFP. This chart shows the positioning gap
The market’s attention is focused on American data this week, but there’s something only those with a trained eye may be looking at: Gold and Silver positioning gap. Financial markets are moving on fears, mostly related to persistently high energy prices driven by the Middle East war. Sure, the US Dollar (USD) is strong, but at what cost?
Silver is more volatile than Gold ahead of PCE and NFP. This chart shows the positioning gap
The market’s attention is focused on American data this week, but there’s something only those with a trained eye may be looking at: Gold and Silver positioning gap. Financial markets are moving on fears, mostly related to persistently high energy prices driven by the Middle East war. Sure, the US Dollar (USD) is strong, but at what cost?