EUR/USD multi-dimensional structural decomposition [Video]
![EUR/USD multi-dimensional structural decomposition [Video]](https://editorial.fxsstatic.com/images/i/eur-usd-fix-01.jpg)
Executive summary
The current macroeconomic price behavior in EUR/USD represents a textbook case of Multi-Dimensional Structural Momentum. By transitioning from the conventional, noisy Price Domain into a discrete Event Domain, the proprietary SMAS 3D (Shved Market Analysis System) decomposes the market into discrete quantum states of institutional supply and demand.
Our quantitative telemetry confirms that the aggressive 4-Hour sell-off (-54.4% structural velocity) was initiated by a surgical rejection off an institutional 8th-Order Supply Cluster (8TF). Trading counter-trend long positions against this freight train carries severe structural risk. We outline a strict Trend-Continuation Short Protocol targeting deeper macroeconomic liquidity pools.
Master execution chart: 8TF super-cluster and phase telemetry
The inception and continuation of the downward cascade is verified with mathematical precision on the master execution chart (Figure 1):
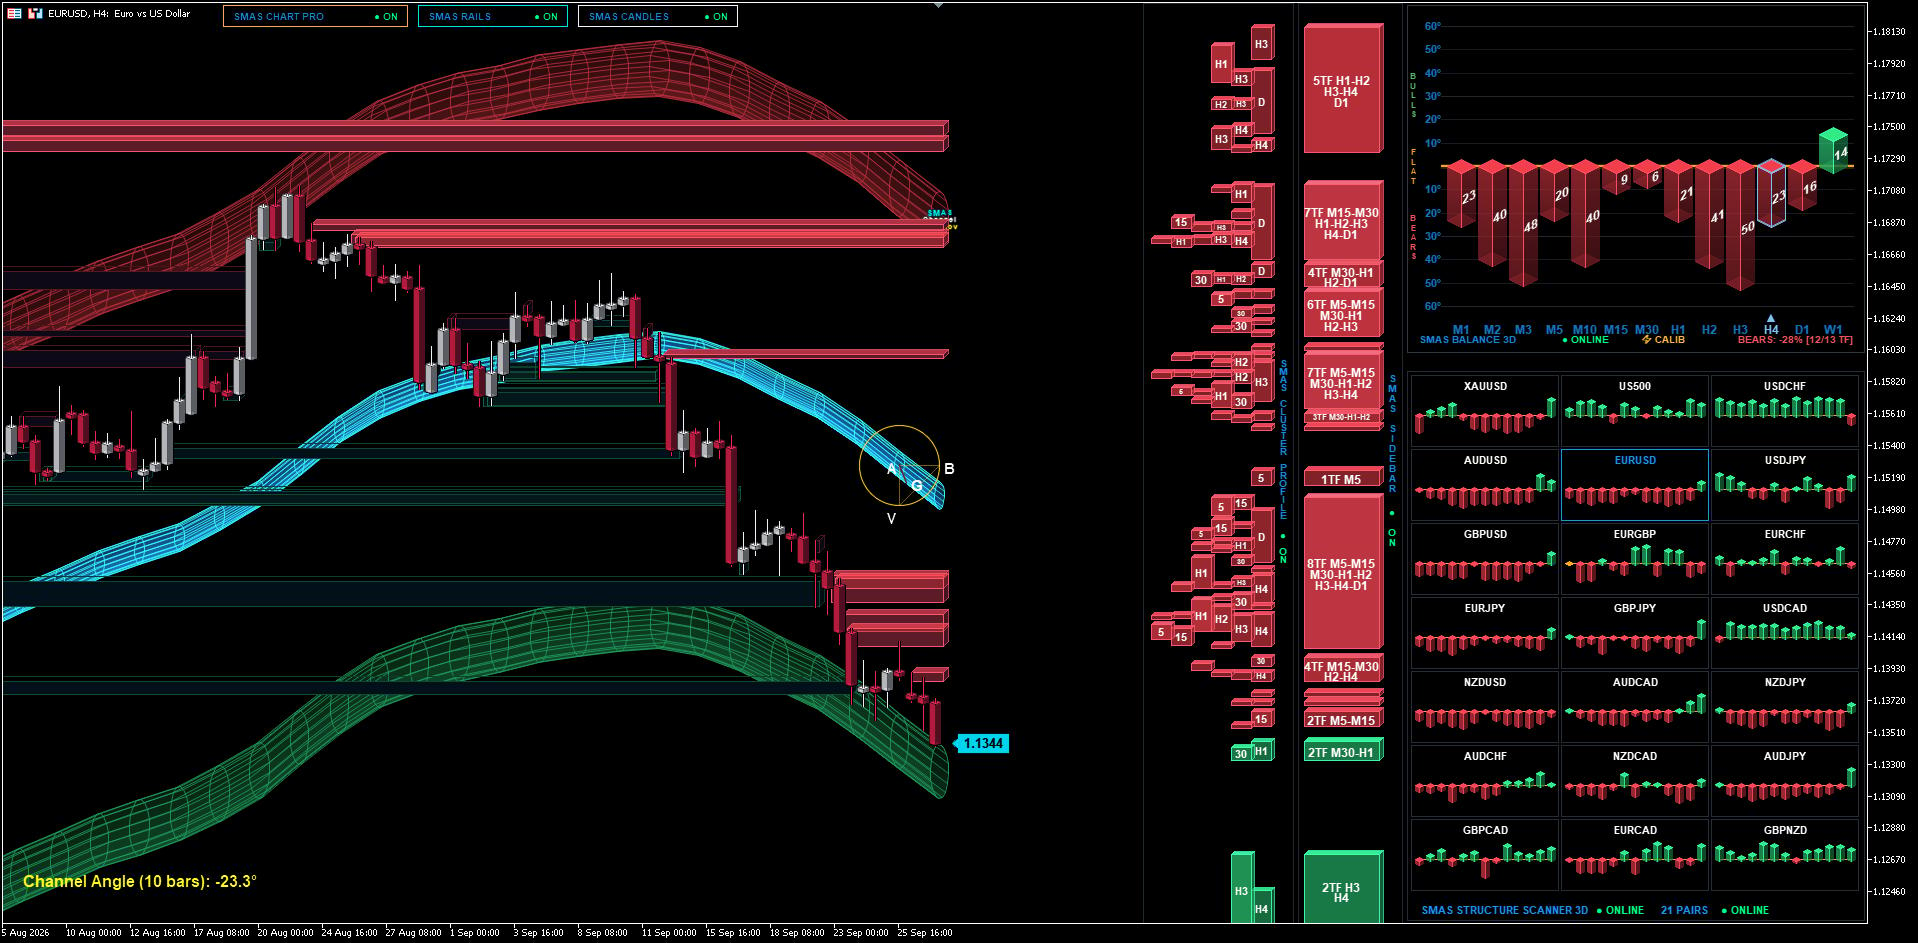
1. 8th-Order Super-Cluster (8TF: M5-M15-M30-H1-H2-H3-H4-D1):
A massive institutional resistance slab was detected in the 1.1406–1.1506 zone, aligning 8 independent time horizons. On September 25, price staged an upward test into this 8TF massif, resulting in total sell volume absorption and initiating a violent downward impulse.
2. Structure Engine Vector (Channel Angle -23.3°):
The ordinary least squares (OLS) regression axis confirmed a dominant bearish structural slope of -23.3° (Triangle A-B-V-G), proving that the market's institutional center of mass is heavily tilted downward.
3. Phase Telemetry Tensor (Structure Balance 3D):
12 out of 13 timeframes simultaneously registered heavy bearish pressure (BEARS -28%), signaling zero probability of an upside breakout through the 8TF wall.
Multi-year macro structural tunnel (W1/D1/H4}
Decompressing the structural hierarchy across the 2.5-year macroeconomic horizon (Figure 2):
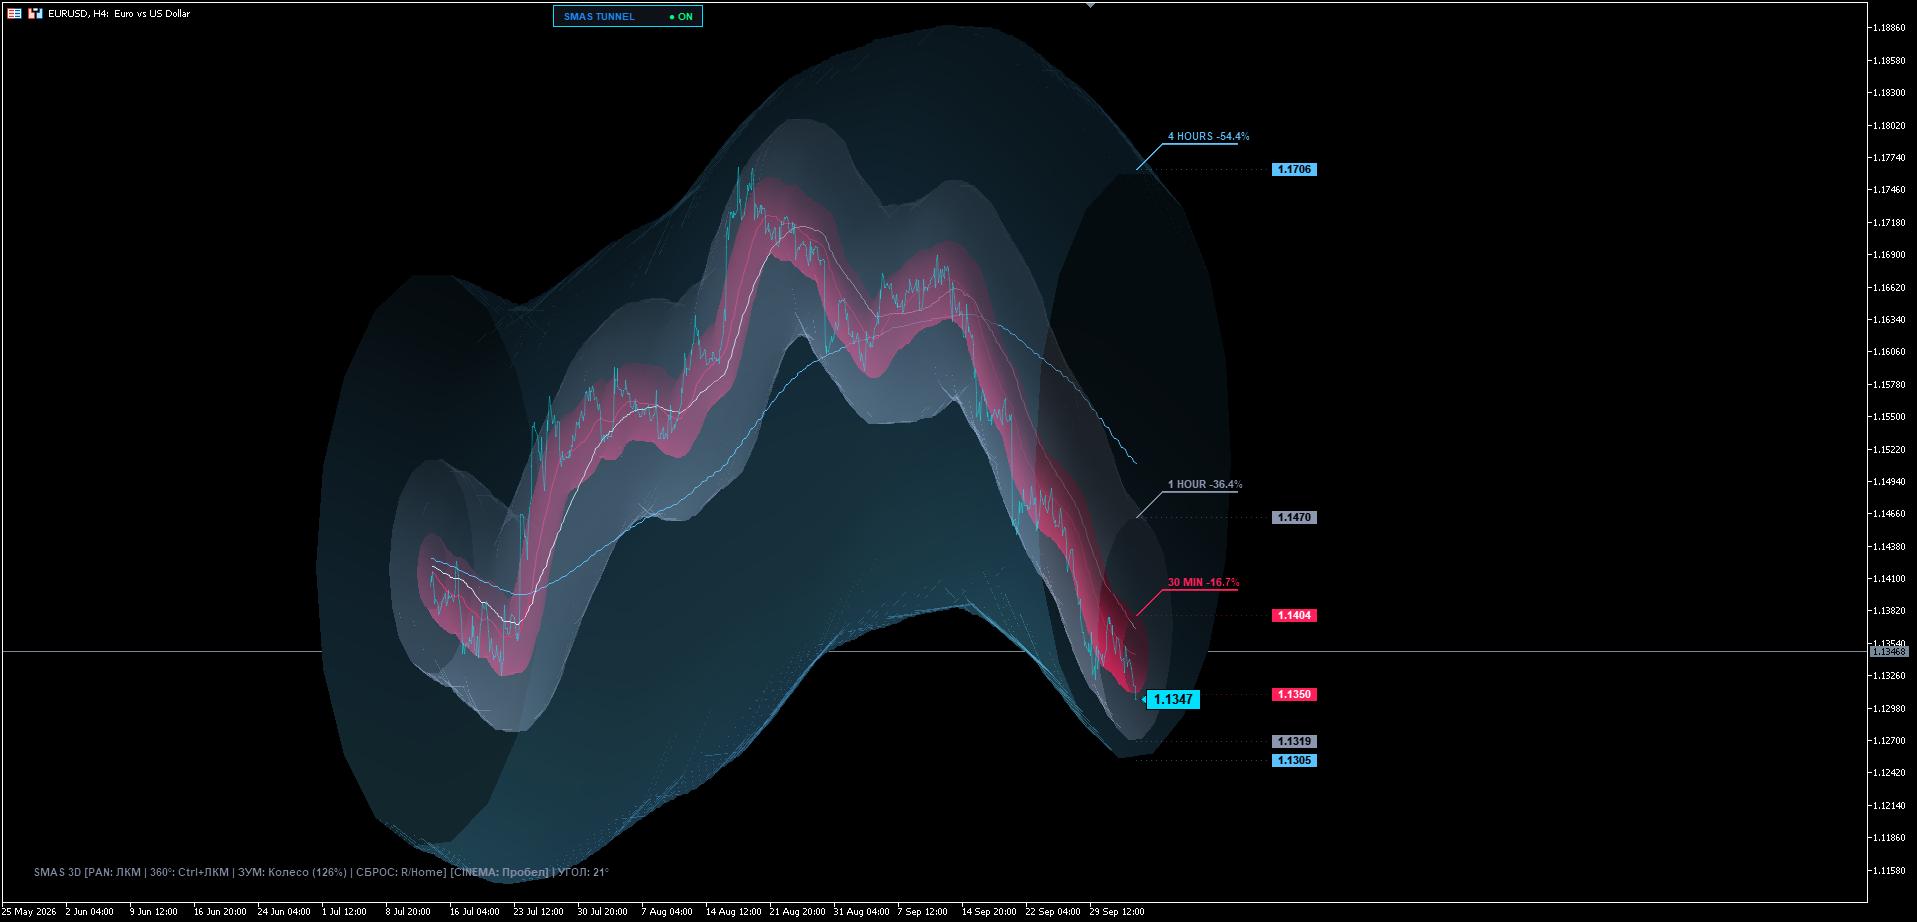
1. Global Weekly Basin (WEEK +24.8%): The primary multi-year secular vector originated from the 1.0615 foundational base toward the 1.2028 upper boundary.
2. Intermediate Daily Correction (DAY -26.1%): The daily cycle maintained a corrective vector with an equilibrium range between 1.1769 and 1.1348.
3. Tactical 4-Hour Cascade (4H -54.4%): High-kinetic selling momentum forced price down into the lower bounds.
4. Macro Collision Point (1.1346 / 1.1348): The 4-hour drop collided directly with the daily boundary (1.1348) and the weekly structural baseline (1.1346).
Tactical volumetric kinetic conduit (H4/H1/M30)
Zooming into the tactical structural stream (Figure 3), the 3D parametric volumetric model reveals the internal kinetic flow:
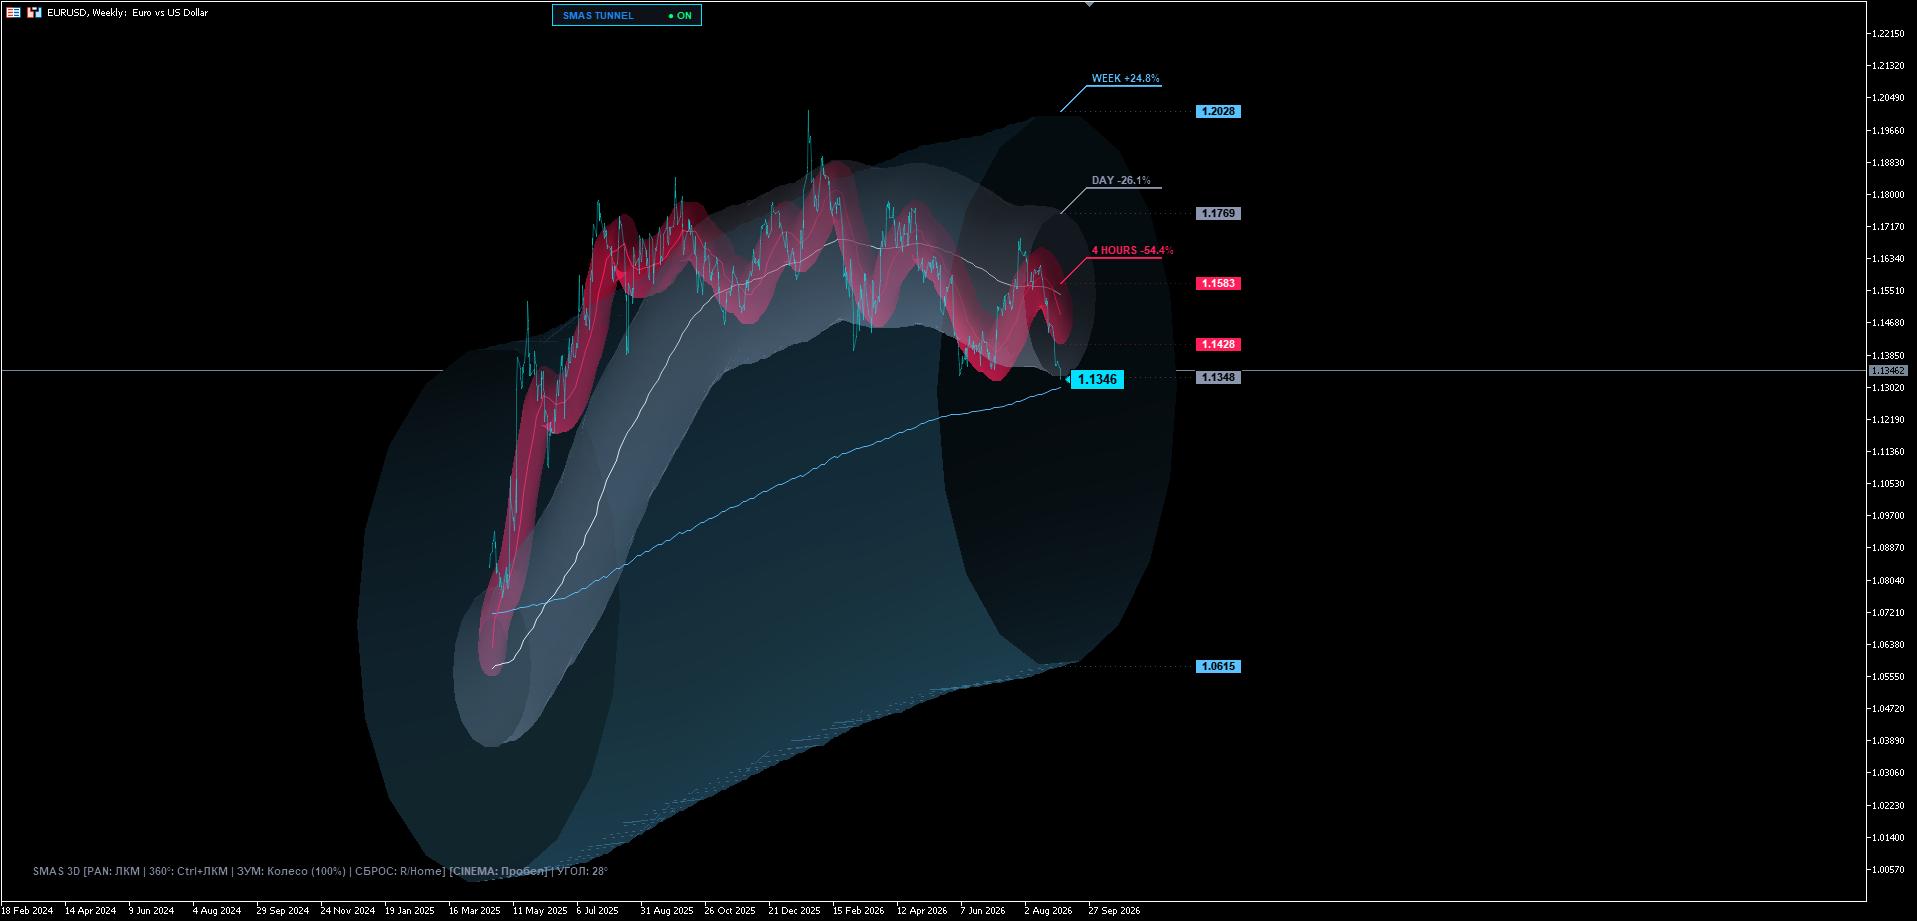
- Multi-Scale Acceleration: The front cap registers triple-timeframe acceleration telemetry: 4H (-54.4%), 1H (-36.4%), and 30M (-16.7%).
- 2σ Boundary Interaction: Price reached the lower 2σ boundary intersection at 1.1347/1.1350. While this represents short-term kinetic deceleration, the overwhelming multi-timeframe bearish alignment dictates trading the structural breakdown rather than fading the trend.
Mathematical execution protocol (Trend-continuation short)
In strict alignment with the SMAS 3D Structure Engine slope (-23.3°) and the 8TF cluster rejection, we establish an institutional Trend-Continuation Breakdown Protocol:
Parameter | Execution Coordinate | Structural Rationale |
Execution Setup | 2TF Demand Breakdown | Await confirmed break below green 2TF cluster (1.1345), followed by a fresh Supply Base (Drop-Base-Drop) |
Entry Zone (Short) | 1.1350 — 1.1365 | Retest of newly confirmed Supply Base on pullback |
Stop Loss (Invalidation) | 1.1410 | Above upper boundary of the fresh Supply Base (+45 pts risk) |
Take Profit 1 (50% Volume) | 1.1250 | Next intermediate structural liquidity basin (+110 pts / Move SL to BE) |
Take Profit 2 (Macro Runner) | 1.1080 | Primary multi-month macro extension (+280 pts) |
Asymmetric Risk / Reward | 1 : 6.2 | High-Alpha Institutional Trend Continuation |
Author

Andrey Shvedov
SMAS Quantum Research
Andrey Shvedov is an active quantitative trader, software architect, and financial market researcher with over 24 years of live market microstructure experience.