EUR/USD Challenges Resistance Line of Downtrend Channel

Meta description: The EUR/USD is unable to break the support zone and is moving sideways, which is increasing the chance of a larger bullish move. A break above the resistance trend line could trigger a bullish breakout.
EUR/USD
4 hour
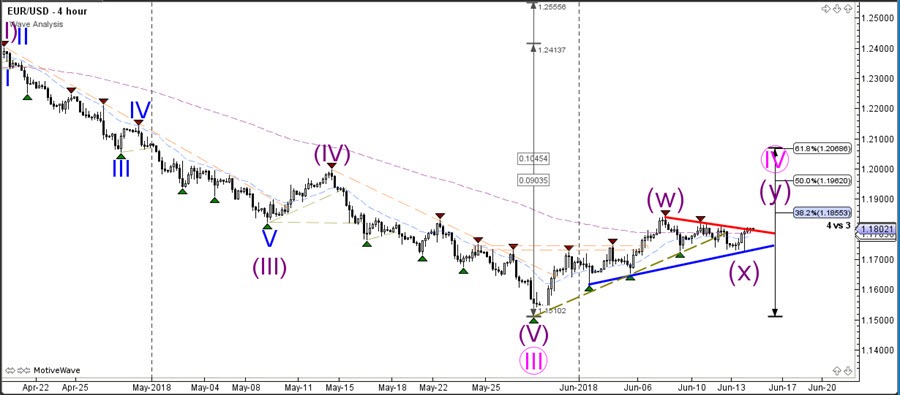
The EUR/USD is unable to break the support zone and is moving sideways, which is increasing the chance of a larger bullish move. A break above the resistance trend line could trigger a bullish breakout.
A bullish break could be part of a wave Y (purple) of a larger wave 4 (pink). The alternative is that the wave 3 (pink) is in fact a wave C and that price is building a larger bullish ABC zigzag.
1 hour
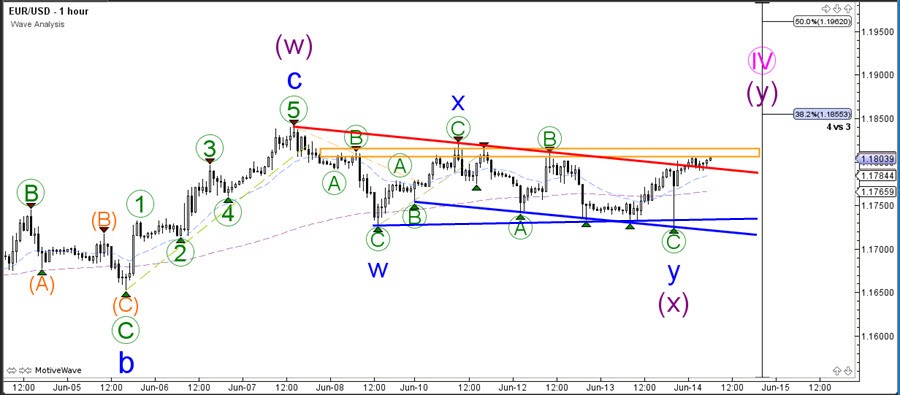
EUR/USD seems to be building a bull flag chart pattern. A bullish break above the resistance could see price move up towards the 50% Fibonacci level whereas a bearish breakout below support could see price test the previous bottom.
Author

Chris Svorcik
Elite CurrenSea
Experience Chris Svorcik has co-founded Elite CurrenSea in 2014 together with Nenad Kerkez, aka Tarantula FX. Chris is a technical analyst, wave analyst, trader, writer, educator, webinar speaker, and seminar speaker of the financial markets.


