EUR/USD: bullish potential stronger, 1.0800/40 at sight

EUR/USD Current price: 1.0743
View Live Chart for the EUR/USD
Majors are on hold ahead of the US opening, with the EUR/USD holding around 1.0740, not far from a fresh multi-week high achieved early Asia at 1.0771. The dollar saw some modest demand with the European opening, but the pair's decline stalled after the release of January preliminary PMIs for the EU, which showed that the economy in the region remains in the growing path. For the whole EU, the services PMI index came in at 53.6, its lowest in 3 months, whilst the manufacturing one rose to 55.1, its highest in 69 months, leaving the composite benchmark at 54.3, slightly below the previous month 54.4. in Germany, manufacturing is estimated to have grew by 56.5 against previous 55.6, with the composite output is estimated at 54.7 for the month. In the US, attention will center in the Manufacturing PMI and Existing Home Sales figures for December.
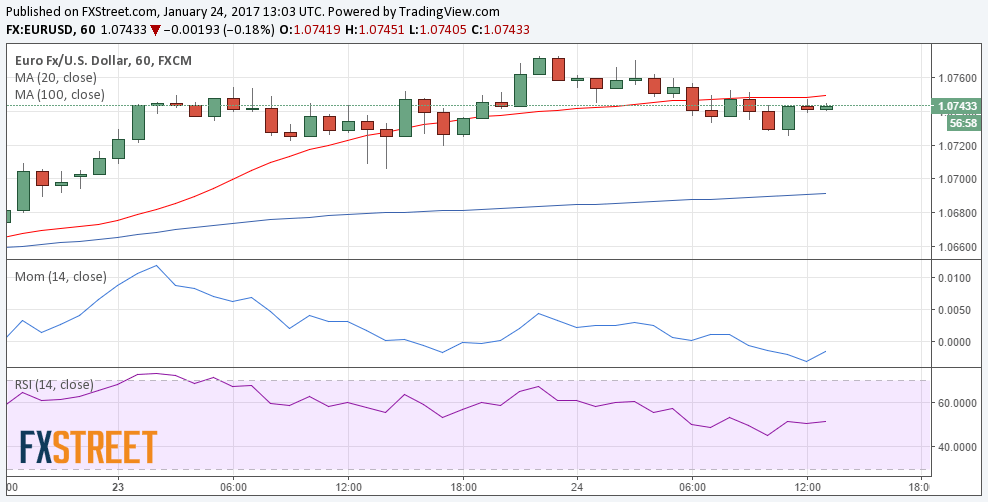
Technically the pair maintains a bullish stance, not only because of persistent higher lows and higher highs daily basis, but also due to the fact that retracements towards 1.0710, a major Fibonacci support are being quickly reversed. Short term the 1 hour chart shows that the price stands a few pips below a flat 20 SMA, whilst the Momentum indicator turned higher below the 100 level and the RSI indicator stands flat at 51, indicating limited buying interest as of now. In the 4 hours chart, however, the upward momentum remains strong, the RSI heads north around 59, while the 20 SMA extended its advance below the current level, now converging with the mentioned Fibonacci support, supporting some additional advances on a break above the daily high.
Support levels: 1.0710 1.0660 1.0610
Resistance levels: 1.0770 1.0810 1.840
GBP/USD Current price: 1.2436
View Live Chart for the GBP/USD
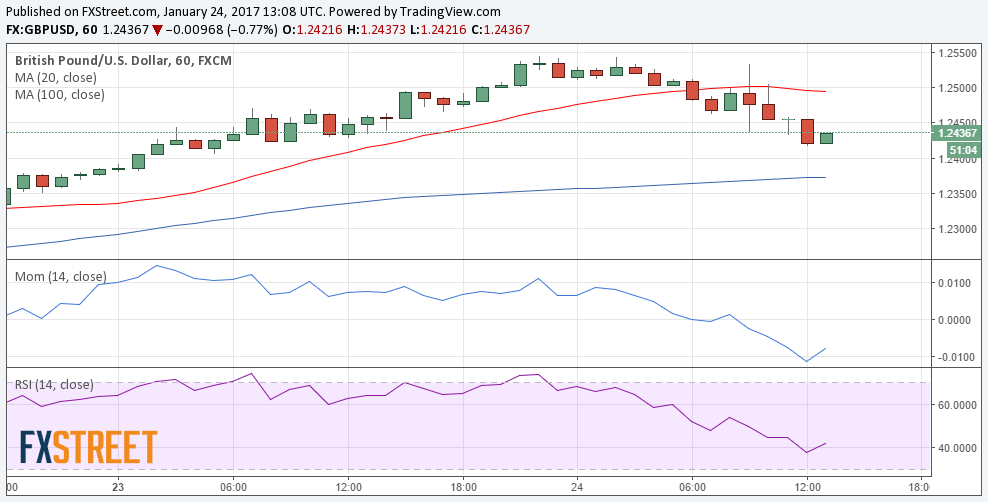
The GBP/USD pair retreated from a fresh monthly high of 1.2543 following the UK's Supreme Court decision to rule against the government in the Brexit case. The Court has decided that before triggering the Art. 50 of the Lisbon treaty, the Houses will have to vote on it. The Pound initially rallied with the news, but quickly reversed course, sending the pair to a daily low of 1.2418. Short term, however, the 1 hour chart shows that the price broke below its 20 SMA, whilst technical indicators are bouncing modestly from near oversold readings, still well below their mid-lines. In the4 hours chart, the price is holding above a bullish 20 SMA, now at 1.2415, whilst technical indicators have retreated from overbought levels, but lost downward strength, holding within positive territory, mostly due to the absence of dollar's demand.
Support levels: 1.2415 1.2380 1.2330
Resistance levels: 1.2470 1.2510 1.2550
USD/JPY Current price: 113.35
View Live Chart for the USD/JPY
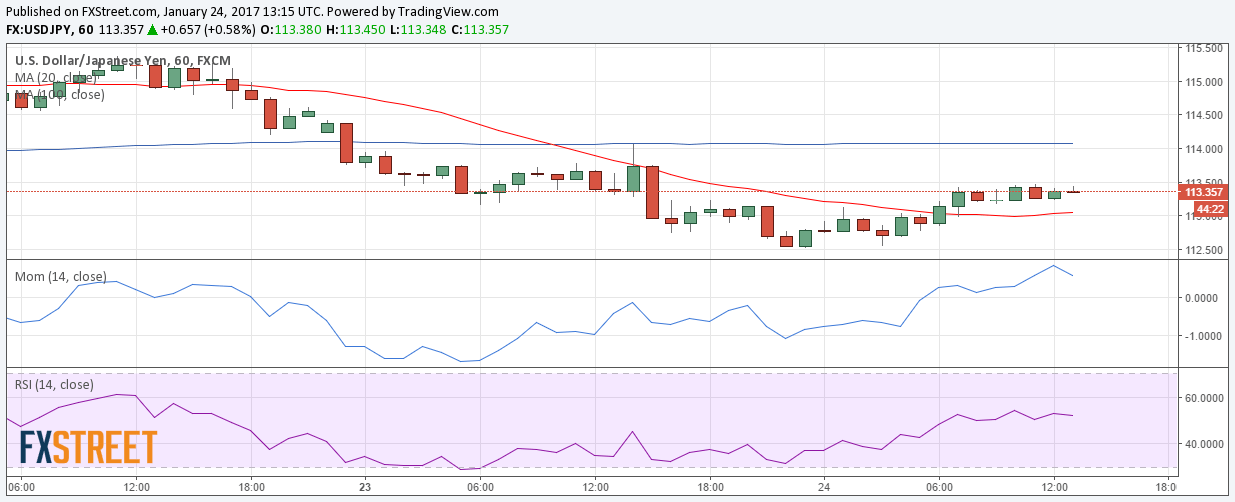
Bears remain in the driver's seat. The USD/JPY pair fell to a fresh monthly low of 112.52, a couple of pips below previous one before regaining the 113.00 level early Europe, still far from signaling a reversal in the ongoing bearish trend. The pair topped around 113.50 so far this Tuesday, holding in a tight 20 pips consolidative range ahead of the US opening. Short term, the 1 hour chart shows that the price remains well below its 100 and 200 SMAs, although the shortest is slightly above the largest, whilst technical indicators have turned lower within positive territory, indicating a limited upward potential but failing to confirm a bearish extension. In the 4 hours chart, however, the pair is clearly bearish, with the price well below a bearish 100 SMA, now at 115.20, and technical indicators having resumed their declines near oversold levels.
Support levels: 113.00 112.55 112.10
Resistance levels: 113.60 114.00 114.45
AUD/USD Current price: 0.7571
View Live Chart for the AUD/USD

The Australian dollar extended its advance up to 0.7608 against the greenback during the past Asian session, but was unable to hold gains above the 0.7600 threshold. The following retracement however, was limited, indicating that the ruling bullish trend remains firm in place. Short term, the 1 hour chart shows that the upward potential is limited with the price above a modestly bullish 20 SMA and indicators about to cross their mid-lines into positive territory. In the 4 hours chart, the price holds above its 20 SMA and indicators head north after bouncing from their mid-lines, maintaining the risk towards the upside.
Support levels: 0.7550 0.7510 0.7470
Resistance levels: 0.7600 0.7640 0.7680
Author

Valeria Bednarik
FXStreet
Valeria Bednarik was born and lives in Buenos Aires, Argentina. Her passion for math and numbers pushed her into studying economics in her younger years.


