EUR/USD Builds Triangle Chart Pattern at 1.1750 Support

Meta description: EUR/USD is building a larger triangle chart pattern and the next move will depend on the breakout direction. A bullish bounce could indicate the start of a wave 4 (purple) correction whereas a bearish breakout could see an expansion of the wave 3 (purple) momentum towards the Fibonacci targets of wave 5.
EUR/USD
4hour
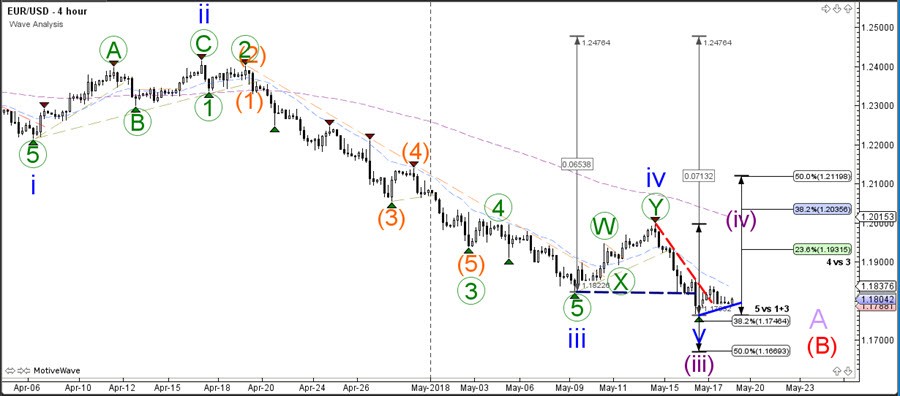
The EUR/USDfailed to break the bottom yesterday. Price action is now building a larger triangle chart pattern and the next move will depend on the breakout direction.
A bullish bounce could indicate the start of a wave 4 (purple) correction whereas a bearish breakout could see an expansion of the wave 3 (purple) momentum towards the Fibonacci targets of wave 5. For the moment a wave 4 seems to be more likely.
1 hour
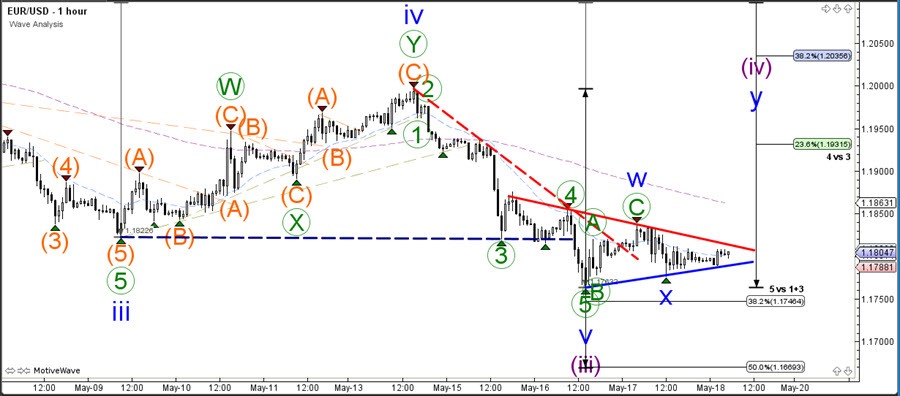
The EUR/USDis building a triangle chart pattern. A break above the resistance (red) could see a bullish breakout take price up to the Fibs of wave 4 whereas a break below the support (blue) could see price test the Fib target of wave 3.
Author

Chris Svorcik
Elite CurrenSea
Experience Chris Svorcik has co-founded Elite CurrenSea in 2014 together with Nenad Kerkez, aka Tarantula FX. Chris is a technical analyst, wave analyst, trader, writer, educator, webinar speaker, and seminar speaker of the financial markets.


